


The Best Free
Online PlantUML Editor for Professional Diagramming
Finding a fast, easy, and versatile text to diagram tool can be a challenge for modern teams. While many basic options exist, users often struggle with rigid features, clunky interfaces, or tools that only handle one specific layout. If you need a simple solution that makes turning text into clear visuals effortless, Visual Paradigm VPasCode is built to deliver the ultimate diagramming experience.
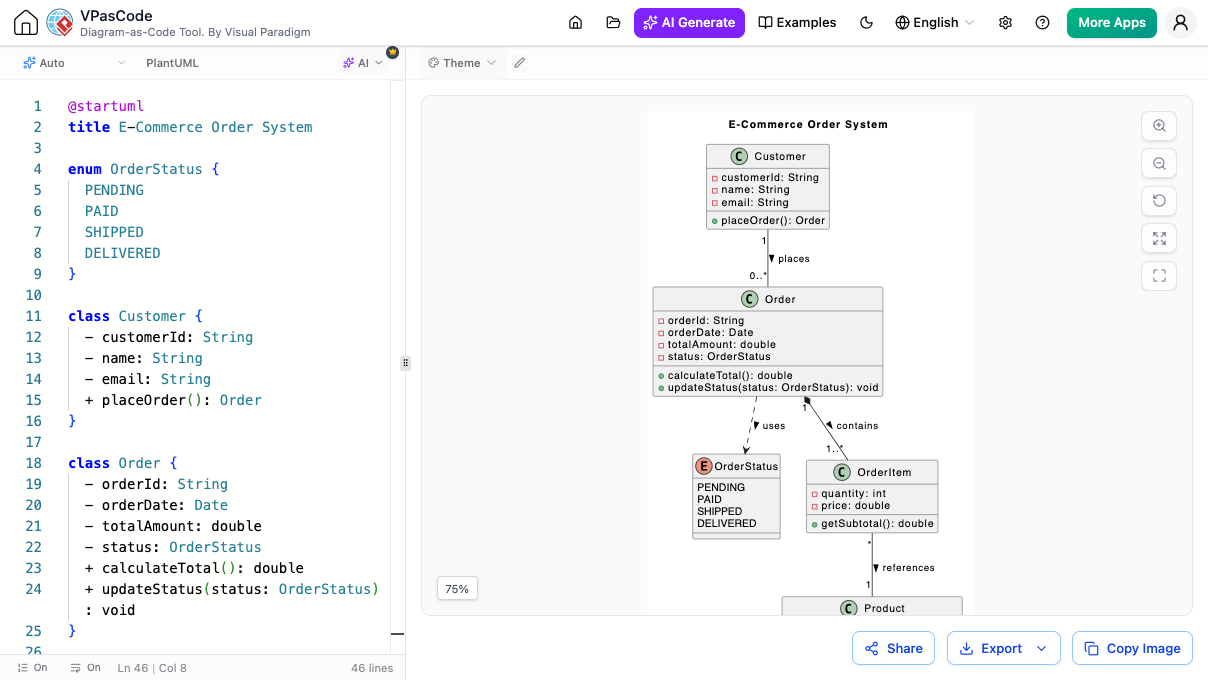
Why VPasCode is the Best PlantUML Editor Available
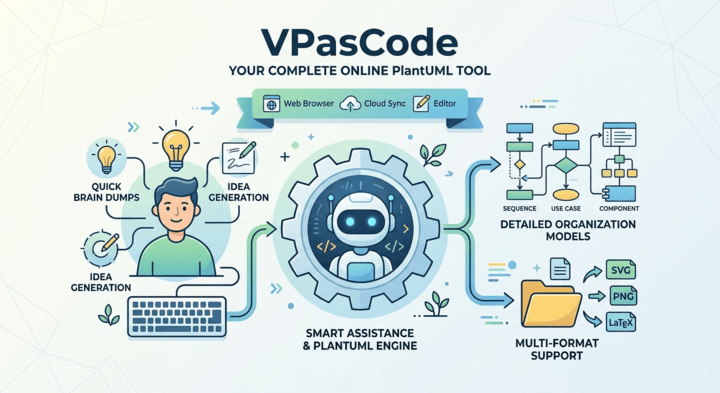
Instant AI Diagram Generation & AI Modifier
コードをゼロから書く手間や、退屈な手動編集を省略しましょう。VPasCodeは組み込みのAI支援を導入し、視覚的作成を迅速化します:
-
AI Diagram Generation
Simply type a plain-language prompt describing what you need (e.g., "Create a user login flow with 2-factor authentication"), and our AI instantly generates the complete PlantUML code for you.
-
AI Diagram Modifier
Need to update an existing chart? Instead of editing lines of code manually, give simple text instructions to the AI modifier (e.g., "Add an email verification step after signup"), and it will refine and expand your diagram script automatically.
Smart AI Diagnostics & Connected Team Docs
プロジェクトが標準的な編集を超える要求をした場合、VPasCodeはオプションの高度なAI機能と文書ツールを提供し、日々の作業を迅速化します。
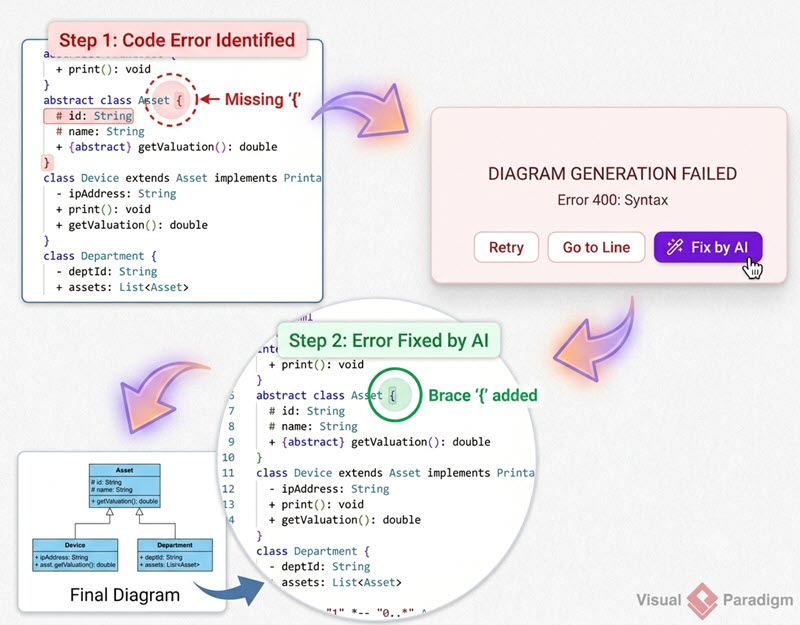
AIによるエラー修正
ワンクリック修正:スペルミスや欠落している構文記号で詰まっていますか?私たちのAIがテキストをチェックし、自動的にスペルミスを修正し、何が修正されたかを説明します。
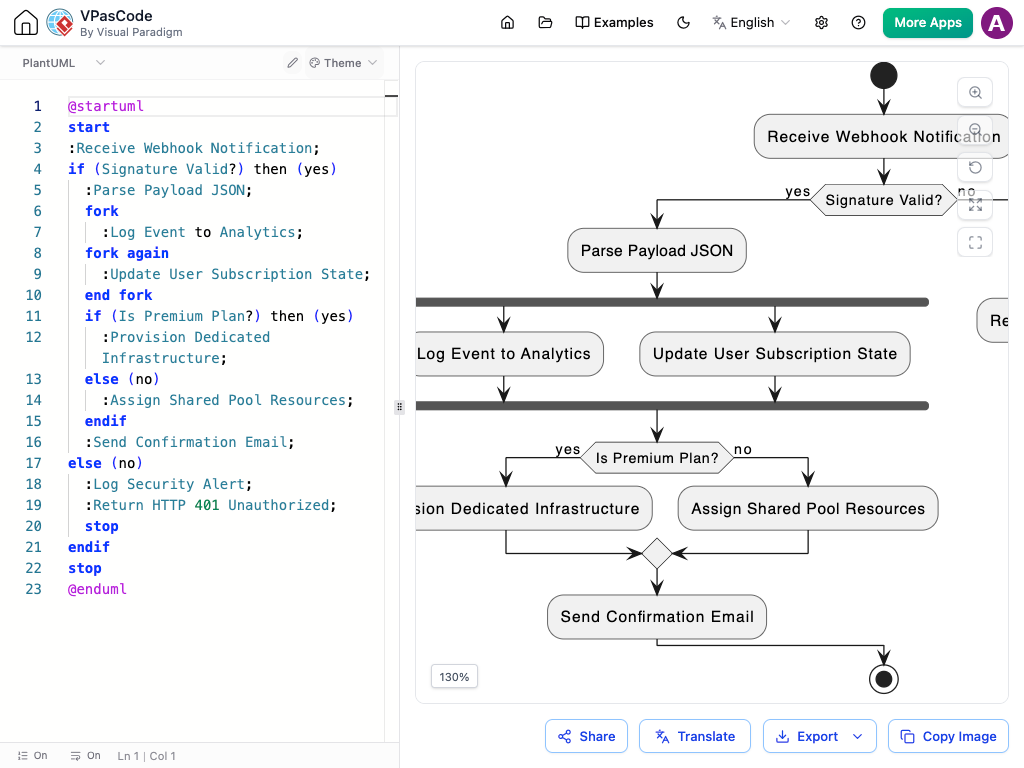
AI駆動の即時翻訳
Complete Core Features & Easy Output
-
Live Real-Time Rendering
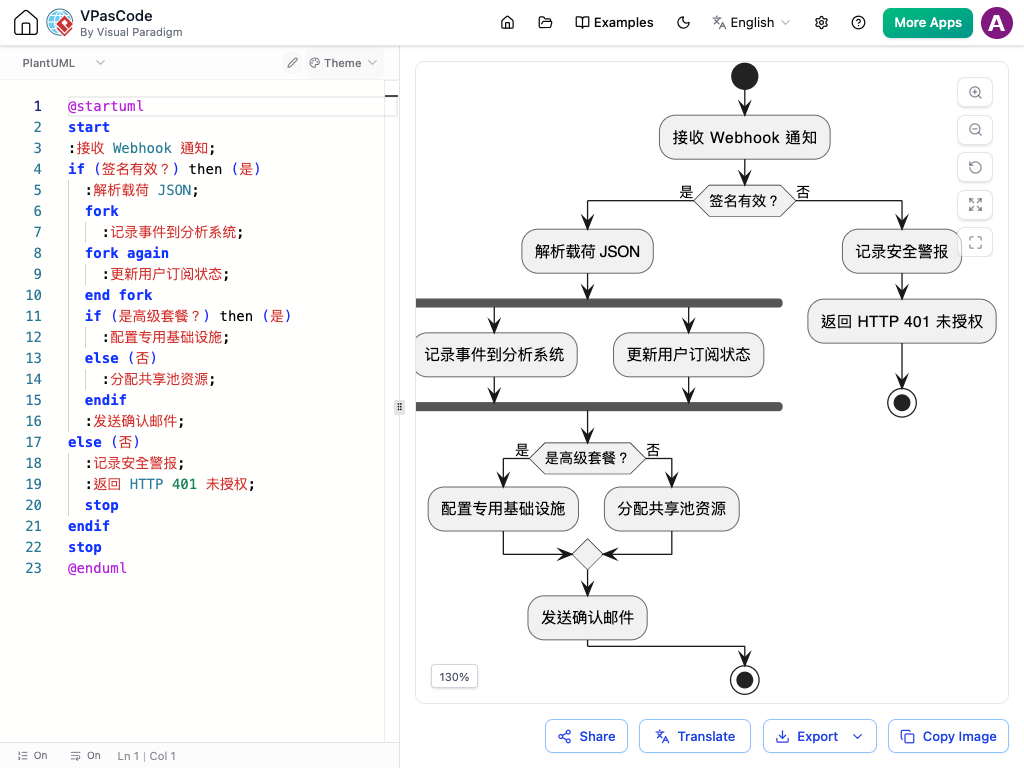
See your text transform into clean visual pictures as you type.
-
High-Quality Image Export
Download your finished charts in crisp SVG or PNG formats for slide decks, reports, and PDFs.
-
Instant Sharing
Share your designs instantly with colleagues via direct web links or QR codes.
-
Built-in Theme Selector
Effortlessly switch between popular built-in PlantUML themes (such as Materia, Cerulean, Amethyst, and CRT) with a single click.


A True One-Stop-Shop Text to Diagram Tool
4つの異なるウェブツールを切り替えるよりも、1つの統合されたワークスペースを使う方が良いのはなぜですか?単一目的のウェブアプリとは異なり、VPasCodeはPlantUMLをはるかに超えます。これは、すべてを1つにまとめたテキストから図へのツールであり、同じアプリケーション内で複数の一般的なチャートスタイルを作成できます:
-
Mermaid.js
Flowcharts, Gantt project charts, Sequence flows
-
Graphviz / DOT
Network structures and connections
-
ECharts
Interactive data charts and visual stats
-
Data Visualizer
Turn data directly from SQL, JSON, and YAML into charts
Frequently Asked Questions
はい!コア機能(テキスト編集、ライブプレビュー、画像エクスポート、リンク共有など)は完全に無料です。高度なAIツールや連携ドキュメント機能は、アップグレードされたパッケージで利用可能です。
インストールや設定は必要ありません。VPasCodeはウェブベースのオンラインPlantUMLエディタとして動作し、すべての視覚的作成をウェブブラウザ内ですべて処理します。
VPasCodeは複数の視覚的ツールを1つのインターフェースに統合しています。PlantUMLを超えて、Mermaidテキスト、Graphvizスクリプト、チャート設定、構造化データを入力または貼り付けることで、ソフトウェアを切り替えることなく視覚的表現を作成できます。
VPasCodeは、Sequence、Class、Use Case、Activity、Component、State、Object、Deployment、Timing、ArchiMate、C4モデル、ERD、WBS、Ganttチャート、Mind Mapsを含む、完全なPlantUML仕様をサポートしています。
あなたが、ワークフローまたはシステムアーキテクチャを平易な言葉で説明するプロンプトを入力します。組み込みのAIが、あなたの説明を直接クリーンなPlantUMLコードに変換し、プレビュー窓で即座にライブレンダリングされます。
Diagram-as-Code Editor
Start Editing PlantUML Now
No sign-up or installation required. Start writing PlantUML or diagram code in seconds.