
Turn Any Code, Schema, or Data into
High-Fidelity Visual Diagrams

Stop wasting time manually aligning shapes. With Visual Paradigm VPasCode, you can automatically render diagrams directly from scripts like PlantUML and Mermaid, data configurations like JSON and SQL, source code, and interactive charts.
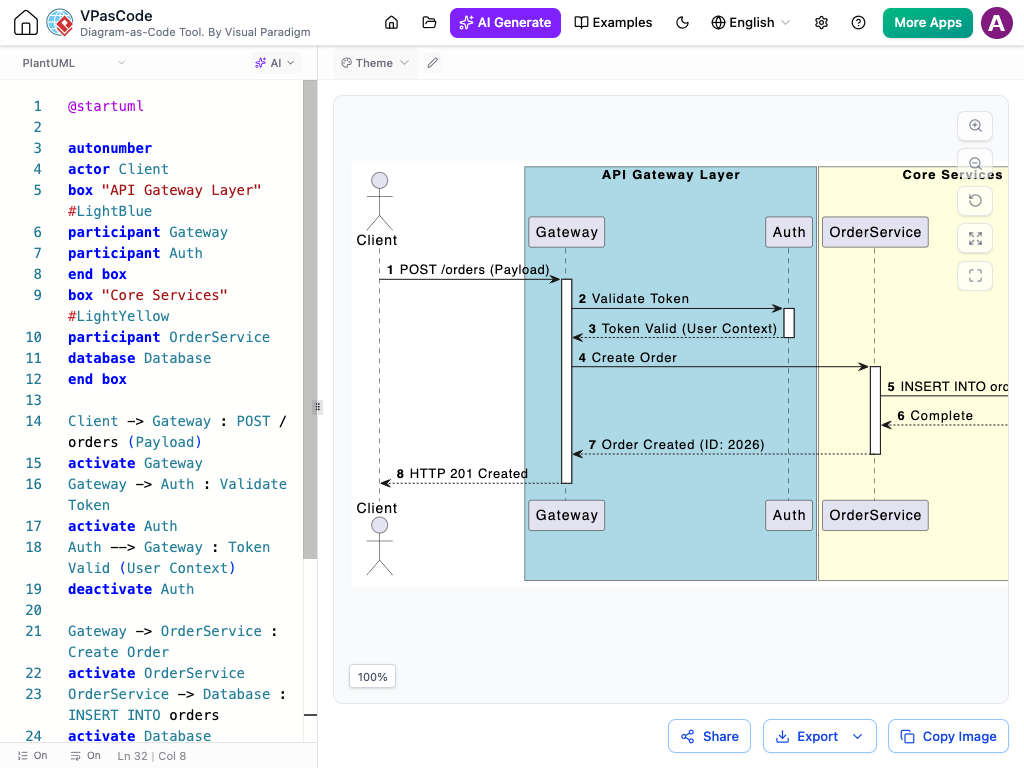
Split view showing PlantUML script rendered into a sequence diagram

Script-Based Modeling

Standard Diagram Engines

Engineers can write and execute PlantUML, Mermaid.js, Graphviz, and D2 scripts directly in browser windows. Easily generate architectural sequence flows, class models, and network topology charts without leaving your editor workspace.

Database & API Visualization

Data & Schema Types

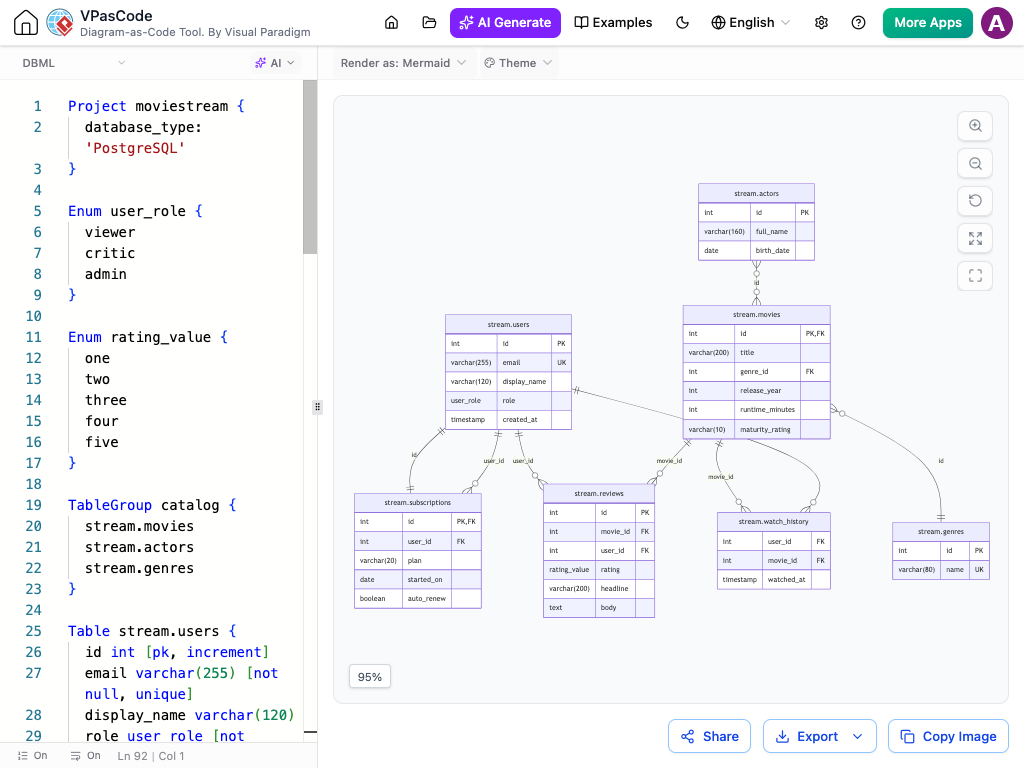
Skip manually drawing table structures or tracing API models. Paste raw configurations in SQL, JSON, YAML, XML, or CSV to instantly generate entity-relationship models and schema maps. We also support expanded data types including JSON Schema, JSONC, JSON5, JSONL/NDJSON, TOON, and TOML. Visualizing structural relationships across complex databases takes only seconds.

Data Visualization & Analytics

ECharts Data Charts

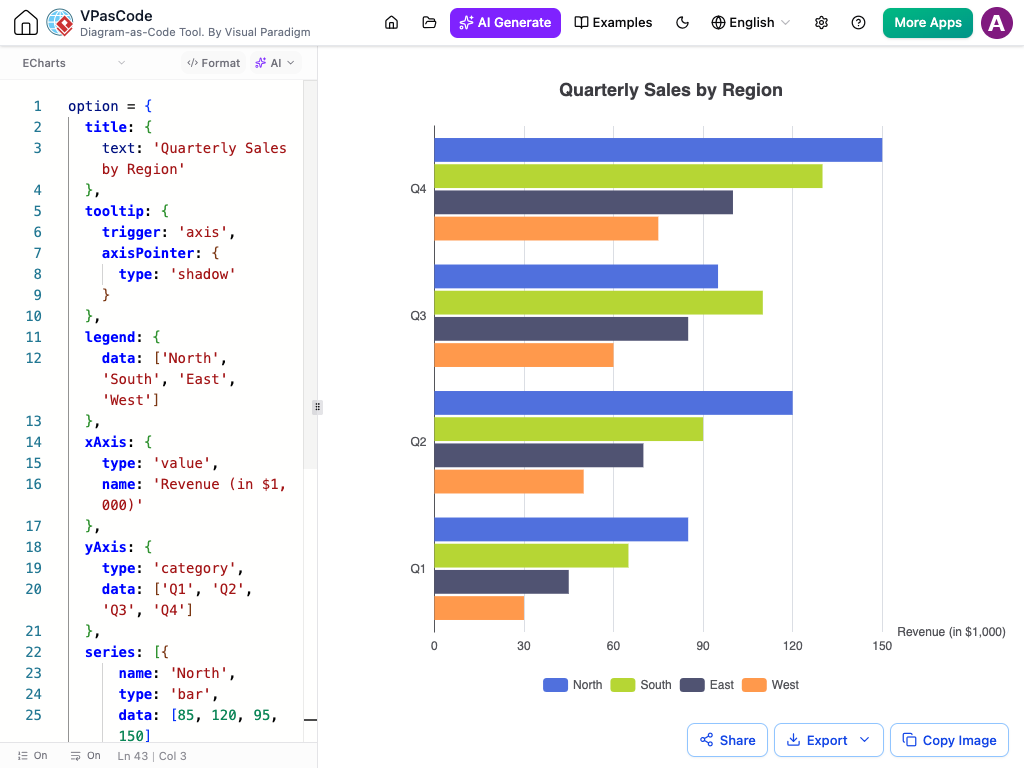
Turn raw data points and structured numbers into interactive data charts instantly with our ECharts support. Render presentation-ready bar, line, pie, and scatter charts directly from plain text configurations to highlight key metrics without using complex charting tools.

Dynamic Mind Mapping

Markmap Mind Maps

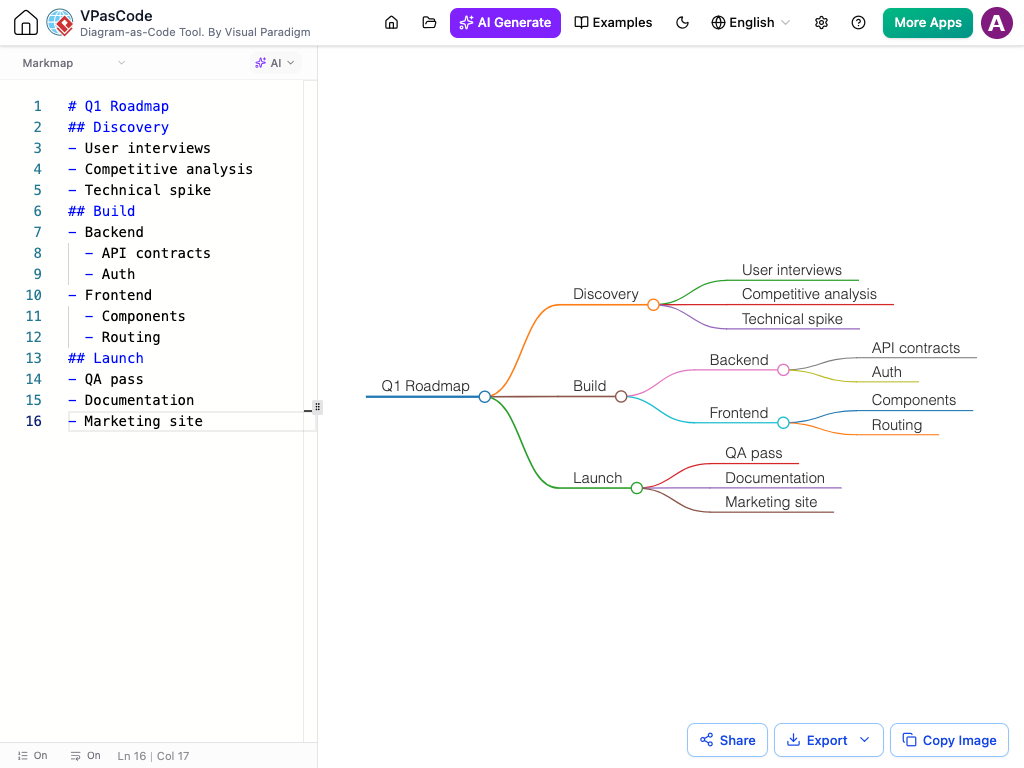
Organize ideas, feature roadmaps, and system breakdowns seamlessly using Markdown. Simply type out standard bulleted lists, and watch them automatically convert into responsive, expandable Markmap mind map trees that give your technical documentation visual clarity.
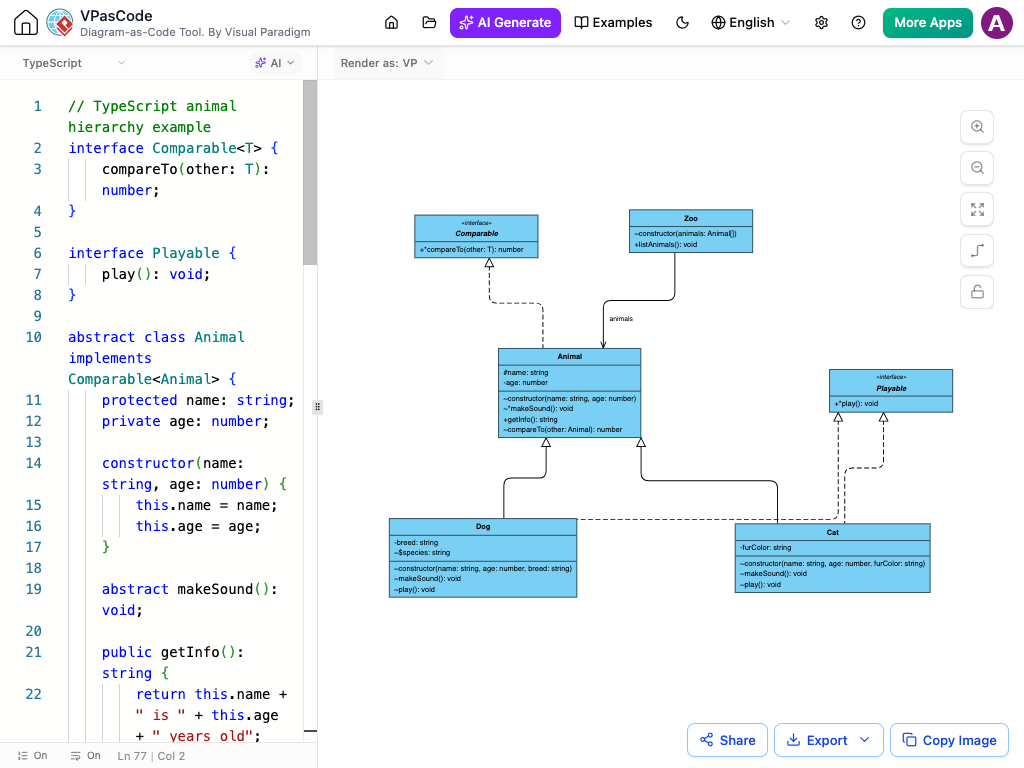
Java and TypeScript files parsed into a structural visual map

Codebase Analysis

Source Code Visualization

Analyze existing projects effortlessly by dropping in actual programming files—including Java, TypeScript, Python, Go, and Rust. We also support full codebase visualization for C#, C, C++, PHP, Ruby, Scala, Zig, Kotlin, Swift, and Elixir. The parser extracts underlying logic and builds clear dependency trees and structural maps automatically to speed up developer onboarding.

Powerful Utilities to Streamline Your Workflow

Built-in tools designed to speed up code editing, enhance visual themes, and make team collaboration seamless.

AI-Powered Diagram Generation

Describe your system architecture or flow in plain language and let the integrated AI assistant instantly generate the underlying diagram script for you.

High-Res Exports & Sharing

Export your visuals as crisp SVG vector graphics, high-resolution PNGs, or PDFs, or generate quick share links for team updates.

Light & Dark Workspace

Toggle seamlessly between light and dark display modes to keep your editing environment comfortable during long coding sessions.

How Your Workflow Transforms

  • Step 1: Choose or Paste Input

    Paste your preferred PlantUML script, SQL schema, source code file, or data list directly into the code panel.

  • Step 2: Auto-Detect Syntax

    Our intelligent parser automatically identifies the incoming file or script type and instantly configures the rendering engine for you.

  • Step 3: Instant Live Preview

    Watch your diagram render side-by-side in real time as you type, allowing you to catch logic errors instantly.

  • Step 4: Export & Embed

    Export crisp, scalable SVG graphics, high-res PNG images, or shareable web links to include directly in your technical documentation.

Ready to Turn Your Code into Visuals?

Convert scripts, schemas, and source code into clean architecture diagrams in seconds. Get started with AI-driven diagramming directly in your browser—no installation needed.
Scroll to Top