


Build Visual Clarity Instantly
VPasCode Core Features
Writing software architectures and workflows should not require tedious manual alignment. A modern text to diagram tool transforms raw logic directly into professional system layouts right from your keyboard. By using code instead of drag-and-drop builders, you ensure your documentation stays precise, easily versionable, and highly maintainable. Whether you are mapping out code structures, data schemas, or system architectures, using a dedicated text to diagram tool keeps your team moving fast without leaving their development workspace.
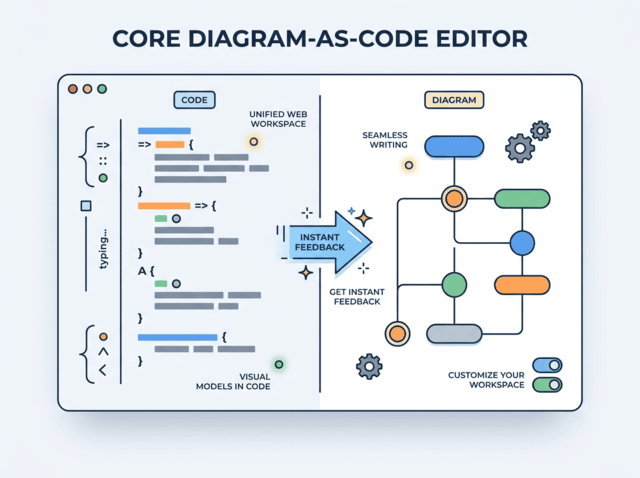
Core Diagram-as-Code Editor
-
Automatic format detection
The workspace automatically identifies your structural scripting syntax on the fly.
-
Real-time preview
Watch your visual maps render and update instantly with every line you type
-
Flexible formatting and themes
Switch easily between light and dark modes, choose custom chart themes, and enjoy automated code neatening for charts and schemas.
-
Seamless sharing and exporting
Download files as vector SVGs or high-res PNG images, or create collaborative web links for quick team reviews.
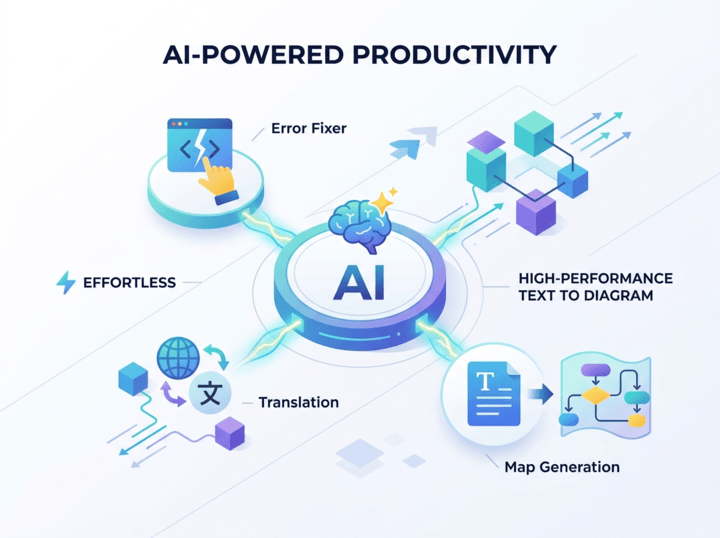
AI-Powered & Advanced Productivity Features
-
AI-powered creation
Type out a simple prompt, topic, or system idea to generate a complete visual model from scratch.
-
AI diagram modification
Easily update existing charts by telling the AI assistant to add, remove, or modify specific steps.
-
AI-Powered Smart error resolution
Catch code syntax issues in real time and fix typos or missing symbols with a side-by-side code diff panel.
-
AI-Powered Native language translation
Translate entire diagram labels, titles, and comments into multiple languages in seconds without breaking your code.
-
Documentation integration
Connect your layouts directly to the OpenDocs pipeline to link visual diagrams with technical documents.
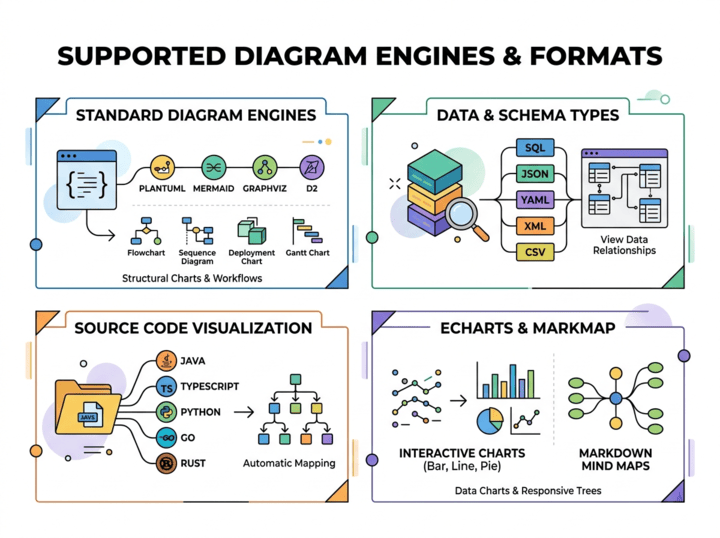
Supported Diagram Engines & Formats
-
Standard Diagram Engines
Write script for PlantUML, Mermaid, Graphviz, and D2 to generate structural charts and workflows.
-
Data & Schema Types
Paste configurations like SQL, JSON variants, YAML, XML, or CSV to view data relationships instantly.
-
Source Code Visualization
Drop in actual programming files—such as Java, TypeScript, Python, Go, or Rust—to map them out automatically.
-
ECharts & Markmap
Turn text lists into interactive data charts (bar, line, pie, scatter) or responsive Markdown-based mind map trees.

Your Connected Diagramming Hub
-
AI Chatbot Integration
Brainstorm system architectures, sequence flows, or class structures directly within your AI chatbot interface. Generate initial diagram scripts on the fly, then send them straight into VPasCode to refine and preview the layout with real-time visual feedback.
-
Visual Paradigm VPasCode
Fine-tune your visual layouts, tweak diagram styling, and clean up script syntax using instant live previews and built-in AI editing tools right inside your browser.
-
Visual Paradigm Desktop
Take your code-based diagrams into VP Desktop when you need heavy-duty modeling—such as deep system architecture analysis, requirement tracking, and full enterprise lifecycle mapping.
-
OpenDocs
Publish your finalized diagrams straight into OpenDocs. Keep your visual layouts connected to your technical documentation so your team always sees updated, accurate charts.
AI-Powered C4 Model Image Import
-
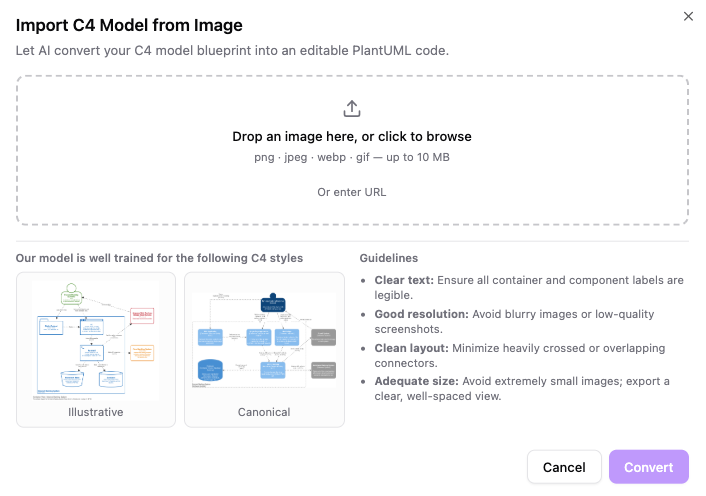
Instant image-to-code conversion
Upload a PNG, WEBP, GIF or JPEG file (or paste a direct image URL) to automatically translate static pixels into standard, reusable PlantUML C4 code.
-
Side-by-side verification
Inspect your original layout right alongside the live preview using a split-screen interface featuring smooth pan and zoom controls.
-
Seamless on-the-fly editing
Once imported, immediately modify container names, restructure components, or update relationship paths directly within the editor.
-
Ecosystem connectivity
Easily push your newly converted code straight into OpenDocs for centralized technical documentation or escalate to Visual Paradigm Desktop for deep enterprise modeling.
Custom AI Endpoint Support
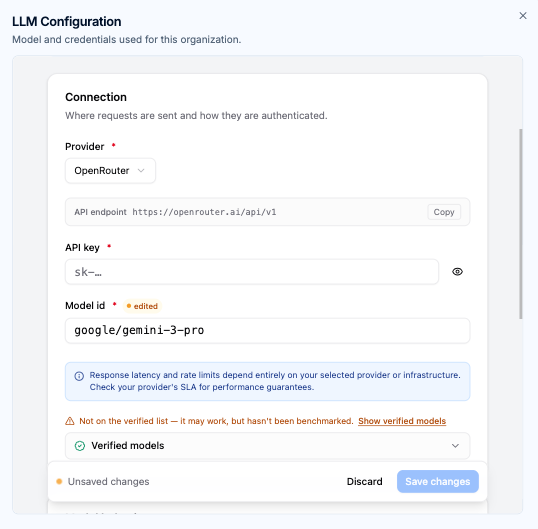
Gain total governance over your AI-driven diagramming workflows. Connect your organization’s approved AI infrastructure directly to VPasCode to maintain data policy compliance, leverage existing provider relationships, and optimize model performance.
-
Enterprise Provider Integration
Connect seamlessly to approved providers including OpenAI, Anthropic, Google, DeepSeek, Mistral, Qwen, and enterprise-grade cloud endpoints.
-
Centralized Workspace Governance
Workspace managers can establish workspace-wide AI configurations to ensure consistent operational standards across all team members.
-
Dedicated API Management
Route AI requests through your organization's managed API keys to satisfy internal security auditing, data governance, and usage tracking.
-
Tailored Model Selection
Deploy high-throughput models for rapid iteration or high-reasoning models for multi-tier architecture design and complex code parsing.
-
Advanced Behavioral Configuration
Fine-tune output parameters, max output tokens, and reasoning effort settings to align model behavior with your team's exact technical requirements.
-
Automated System Fallback
Maintain continuous operational uptime with instant workspace fallback to Visual Paradigm's default AI infrastructure whenever custom routing is disabled.
Explore What's Included in Every Edition
| VPasCode - Product Feature Matrix & Edition Breakdown | ||||||||||
|---|---|---|---|---|---|---|---|---|---|---|
| Features & Capabilities | Free | Starter | Advance | Combo | Deluxe | |||||
| Supported Standards | ||||||||||
| PlantUML Support | ✓ | ✓ | ✓ | ✓ | ✓ | |||||
| Mermaid Support | ✓ | ✓ | ✓ | ✓ | ✓ | |||||
| Graphviz Support | ✓ | ✓ | ✓ | ✓ | ✓ | |||||
| Markmap Support | ✓ | ✓ | ✓ | ✓ | ✓ | |||||
| ECharts Support | ✓ | ✓ | ✓ | ✓ | ✓ | |||||
| Diagram-as-Code Editor | ||||||||||
| Live Code Rendering | ✓ | ✓ | ✓ | ✓ | ✓ | |||||
| Auto Code Format Detection | ✓ | ✓ | ✓ | ✓ | ✓ | |||||
| Word-wrap Toggle | ✓ | ✓ | ✓ | ✓ | ✓ | |||||
| Share and Export | ||||||||||
| Share as URL & Embed Code | ✓ | ✓ | ✓ | ✓ | ✓ | |||||
| Share on Social Media & QR Code | ✓ | ✓ | ✓ | ✓ | ✓ | |||||
| Export as PNG / Copy Image | ✓ | ✓ | ✓ | ✓ | ✓ | |||||
| Export as SVG (Vector Graphics) | ✓ | ✓ | ✓ | ✓ | ✓ | |||||
| AI-Powered Tools | ||||||||||
| Diagram Code Translation | ✓ | ✓ | ||||||||
| Code Correction with Detailed Explanation | ✓ | ✓ | ||||||||
| AI C4 Model Import | ✓ | ✓ | ||||||||
| Custom AI Endpoint | ✓ | |||||||||
| Integration & Ecosystem | ||||||||||
| Send Diagram to OpenDocs Pipeline | ✓ | ✓ | ||||||||
| Edit Diagram in Visual Paradigm Online | ✓ | ✓ | ||||||||
Create your own
Ready to build beautiful diagrams with code?
No credit card. No installation required. Write Mermaid, PlantUML, and Graphviz right from your dashboard.