


Introduction: Modeling the Architecture of Renewable Energy
In the rapidly evolving landscape of sustainable energy, managing large-scale solar farms requires more than just hardware; it demands robust software architecture capable of handling complex hierarchies, real-time telemetry, and operational workflows. A Solar Farm Management System is not merely a dashboard; it is a critical infrastructure component that bridges physical assets with digital control. Architects and software engineers face the challenge of representing these intricate relationships clearly before a single line of production code is written.
Visual modeling plays a pivotal role in this phase. By using diagramming-as-code with PlantUML, teams can define the static structure of their system—classes, attributes, and relationships—in a text-based format that is version-friendly, reviewable, and instantly renderable. This tutorial serves as a masterclass on constructing a professional Class Diagram for a Solar Farm Management System using VPasCode. We will explore how to model the physical hierarchy from individual panels to entire power plants, integrate operational roles, and capture data flows for energy monitoring.
VPasCode empowers developers to write this code and see the diagram render live in the browser, eliminating the need for local installations or complex environment configurations. This approach accelerates the design phase, ensuring that stakeholders agree on the system structure before implementation begins.
Understanding the Model: Purpose, Scope & Problem Framing
Diagram Abstraction & Representation
A Class Diagram is the backbone of object-oriented design, depicting the static structure of a system. In the context of energy management, this diagram abstracts the physical world into software objects. It defines what data exists (attributes like voltage, efficiency, and location), how the system behaves (methods like convertDCtoAC or calculateProgress), and how these entities relate to one another.
This specific diagram models the hierarchical ownership of assets. For instance, a SolarFarm is composed of multiple PowerPlants, which in turn aggregate SolarArrays and Inverters. It also captures the operational context, linking human actors like MaintenancePersonnel and SystemOperators to the technical assets they manage.
Target Domain Scope & Scenario
The scope of this model is centered on a large-scale renewable energy operation. It intentionally focuses on the core domain entities required for centralized monitoring and issue detection. The boundaries are defined to include the physical generation assets, the telemetry data they generate, and the personnel responsible for their upkeep. External dependencies, such as the public grid or weather APIs, are represented as associations rather than full implementations, keeping the diagram focused on the internal system architecture.
Key Takeaways & Educational Insights
By studying and building this diagram, readers will gain:
- Structural Clarity: Understanding how to model complex hierarchies using composition and aggregation relationships.
- Role Separation: Seeing how different user roles (Operators vs. Maintenance) interact with the system.
- Data Modeling: Learning how to represent real-time telemetry data as a distinct class linked to physical assets.
Complete Diagram & Full Source Code
Below is the finished blueprint of the Solar Farm Management System. You can visualize the end goal immediately before diving into the construction process.
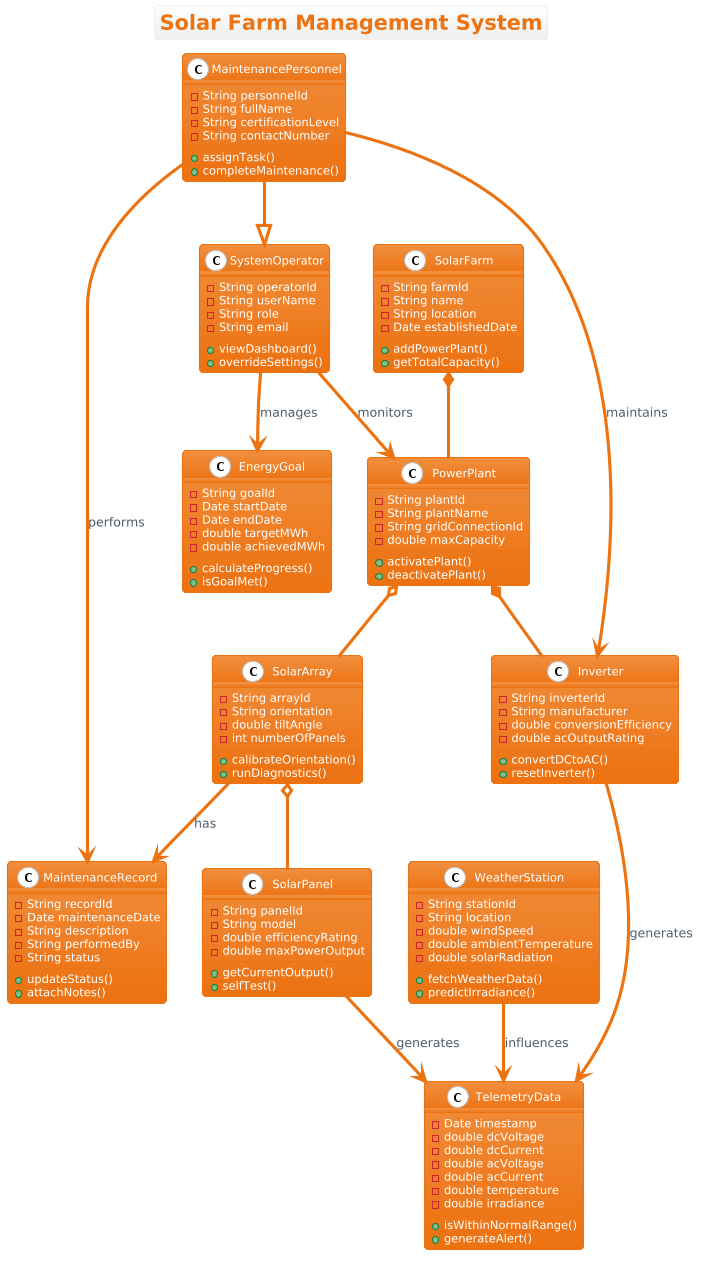
Copy the complete source code below to explore the full implementation in VPasCode.
@startuml
!theme aws-orange
title Solar Farm Management System

/'
This class diagram models the core domain entities and their relationships for a Solar Farm Management System.
The system is designed to monitor and control a network of solar energy generation assets.
It tracks physical solar panels organized into arrays and inverters, which are grouped into larger power plants.
The diagram captures the hierarchical structure of the physical assets, their operational status, and real-time telemetry data.
It also includes actors like maintenance personnel and system operators who interact with the system to perform maintenance tasks and manage energy production goals.
The context is a large-scale renewable energy operation that requires centralized monitoring, issue detection, and reporting.
'/

class SolarFarm {
  - String farmId
  - String name
  - String location
  - Date establishedDate
  + addPowerPlant()
  + getTotalCapacity()
}

class PowerPlant {
  - String plantId
  - String plantName
  - String gridConnectionId
  - double maxCapacity
  + activatePlant()
  + deactivatePlant()
}

class SolarArray {
  - String arrayId
  - String orientation
  - double tiltAngle
  - int numberOfPanels
  + calibrateOrientation()
  + runDiagnostics()
}

class SolarPanel {
  - String panelId
  - String model
  - double efficiencyRating
  - double maxPowerOutput
  + getCurrentOutput()
  + selfTest()
}

class Inverter {
  - String inverterId
  - String manufacturer
  - double conversionEfficiency
  - double acOutputRating
  + convertDCtoAC()
  + resetInverter()
}

class TelemetryData {
  - Date timestamp
  - double dcVoltage
  - double dcCurrent
  - double acVoltage
  - double acCurrent
  - double temperature
  - double irradiance
  + isWithinNormalRange()
  + generateAlert()
}

class MaintenanceRecord {
  - String recordId
  - Date maintenanceDate
  - String description
  - String performedBy
  - String status
  + updateStatus()
  + attachNotes()
}

class MaintenancePersonnel {
  - String personnelId
  - String fullName
  - String certificationLevel
  - String contactNumber
  + assignTask()
  + completeMaintenance()
}

class SystemOperator {
  - String operatorId
  - String userName
  - String role
  - String email
  + viewDashboard()
  + overrideSettings()
}

class EnergyGoal {
  - String goalId
  - Date startDate
  - Date endDate
  - double targetMWh
  - double achievedMWh
  + calculateProgress()
  + isGoalMet()
}

class WeatherStation {
  - String stationId
  - String location
  - double windSpeed
  - double ambientTemperature
  - double solarRadiation
  + fetchWeatherData()
  + predictIrradiance()
}

' Generalization (Inheritance)
MaintenancePersonnel --|> SystemOperator

' Composition - SolarFarm owns PowerPlants
SolarFarm *-- PowerPlant

' Aggregation - PowerPlant groups SolarArrays
PowerPlant o-- SolarArray

' Aggregation - SolarArray groups SolarPanels
SolarArray o-- SolarPanel

' Composition - Inverter is composed within PowerPlant
PowerPlant *-- Inverter

' Association - SolarPanel sends TelemetryData
SolarPanel --> TelemetryData : generates

' Association - Inverter also sends TelemetryData
Inverter --> TelemetryData : generates

' Association - MaintenanceRecord linked to SolarArray
SolarArray --> MaintenanceRecord : has

' Association - MaintenancePersonnel performs MaintenanceRecord
MaintenancePersonnel --> MaintenanceRecord : performs

' Association - SystemOperator manages EnergyGoal
SystemOperator --> EnergyGoal : manages

' Association - WeatherStation affects TelemetryData
WeatherStation --> TelemetryData : influences

' Association - SystemOperator monitors PowerPlant
SystemOperator --> PowerPlant : monitors

' Association - MaintenancePersonnel maintains Inverter
MaintenancePersonnel --> Inverter : maintains

@endumlStep-by-Step Architectural Walkthrough
Phase 1: Canvas Configuration & Layout Directives
Before defining classes, we set the stage for the diagram. VPasCode supports various themes to match corporate branding or personal preference. Here, we use the aws-orange theme to give the diagram a professional, industrial look suitable for energy sector documentation.
!theme aws-orange
title Solar Farm Management System

' Comment block for context
/'
This class diagram models the core domain entities...
'/
The title directive ensures the diagram has a clear header. The comment block (enclosed in /' and '/) provides context for anyone reading the code later, explaining the domain scope without cluttering the visual rendering.
Phase 2: Declaring Core Entities, Actors, and Boundaries
Next, we define the classes. In PlantUML, a class is declared using the class keyword. We organize them logically: physical assets first, then data, then actors.
class SolarFarm {
  - String farmId
  - String name
  + addPowerPlant()
}
Attributes are marked with - (private) and methods with + (public). For example, SolarFarm owns the farmId and exposes the ability to addPowerPlant. We repeat this for PowerPlant, SolarArray, and SolarPanel to establish the physical hierarchy.
Phase 3: Mapping Data Flows & Key Interactions
Relationships define how classes interact. In this model, we distinguish between Composition (strong ownership) and Aggregation (weak ownership).
' Composition - SolarFarm owns PowerPlants
SolarFarm *-- PowerPlant

' Aggregation - PowerPlant groups SolarArrays
PowerPlant o-- SolarArray
Composition (*--) implies that if the parent is destroyed, the child is too. A PowerPlant cannot exist without being part of a SolarFarm. Aggregation (o--) implies the child can exist independently. A SolarArray might be moved to another plant, hence aggregation is used here.
We also model data flow. SolarPanel and Inverter both generate TelemetryData. This is modeled as an association arrow pointing to the data class.
Phase 4: Grouping, Annotations & Visual Polish
Finally, we add the human element. MaintenancePersonnel and SystemOperator represent the actors. We use Generalization (inheritance) to show that a MaintenancePersonnel is also a type of SystemOperator.
' Generalization (Inheritance)
MaintenancePersonnel --|> SystemOperator
The --|> syntax indicates that the maintenance personnel inherits the capabilities of a system operator. We conclude by linking maintenance records and energy goals, ensuring the diagram covers the full operational lifecycle from generation to reporting.
Syntax & Keyword Deep Dive
To master PlantUML class diagrams, you must understand the specific syntax keywords used in this model.
class: Declares a new class entity with its internal structure.-and+: Visibility modifiers.-denotes private members (internal state), while+denotes public methods (interactions).*--(Composition): Represents a strong “part-of” relationship where lifecycle dependency is tight.o--(Aggregation): Represents a “has-a” relationship where parts can exist independently.--|>(Generalization): Indicates inheritance, where one class is a specialized version of another.-->(Association): Indicates a link between two classes, often with a label like: generatesor: monitorsto clarify the relationship./'and'/: Used to wrap multi-line comments that do not render visually but provide documentation within the code.
Best Practices & Pitfalls to Avoid
When modeling complex systems like energy management platforms, adhere to these best practices:
- Maintain Hierarchy Clarity: Do not mix composition and aggregation indiscriminately. Ensure that the ownership semantics match your business logic (e.g., a panel belongs to an array, but an array might move).
- Separate Data from Logic: Keep data classes (like
TelemetryData) distinct from entity classes (likeSolarPanel) to keep the model clean and understandable. - Use Descriptive Labels: Always label associations (e.g.,
: monitors) rather than leaving them blank. This prevents ambiguity when reading the diagram later. - Limit Scope: Do not try to model every single database field. Focus on the domain entities that drive the system’s behavior.
Try It Yourself with VPasCode
Start Building PlantUML Class Diagrams Faster with VPasCode
Instantly render, customize, and export your Solar Farm Management System diagrams online without installing any tools.