


In the era of Industry 4.0, IoT (Internet of Things) systems are the backbone of modern manufacturing. Ensuring machine health is critical to preventing downtime, safety hazards, and equipment failure. One of the most vital parameters to monitor in heavy machinery is temperature. A malfunctioning cooling system or overheating bearings can lead to catastrophic production losses.
To design these systems effectively, software architects and engineers need more than just text-based logs; they need visual models that clearly depict the flow of data and decision-making processes. Activity diagrams are the industry-standard tool for this purpose, illustrating the sequence of actions and the flow of control within a system. However, maintaining these diagrams can be cumbersome if done manually in drag-and-drop tools, especially when requirements change rapidly.
Using PlantUML with VPasCode transforms this process into a streamlined, developer-centric workflow. VPasCode is a free, web-based diagram-as-code editor that allows you to write code and see the diagram render instantly in your browser. This approach ensures your documentation remains versioned within your codebase, eliminates manual formatting errors, and speeds up the prototyping of complex IoT workflows.
In this masterclass, we will construct a comprehensive Activity Diagram for a Machine Temperature Monitoring process. We will utilize swimlanes to separate responsibilities between sensors, gateways, and operators, while incorporating conditional logic and parallel processing to simulate real-world factory floor dynamics.
Understanding the Model: Purpose, Scope & Problem Framing
Diagram Abstraction & Representation
An Activity Diagram in PlantUML models the dynamic behavior of a system. Unlike a static class diagram, this diagram focuses on the process. It answers the question: “What happens next?” In the context of our IoT system, the diagram abstracts the physical hardware (sensors) and the software infrastructure (gateways, dashboards) into logical steps.
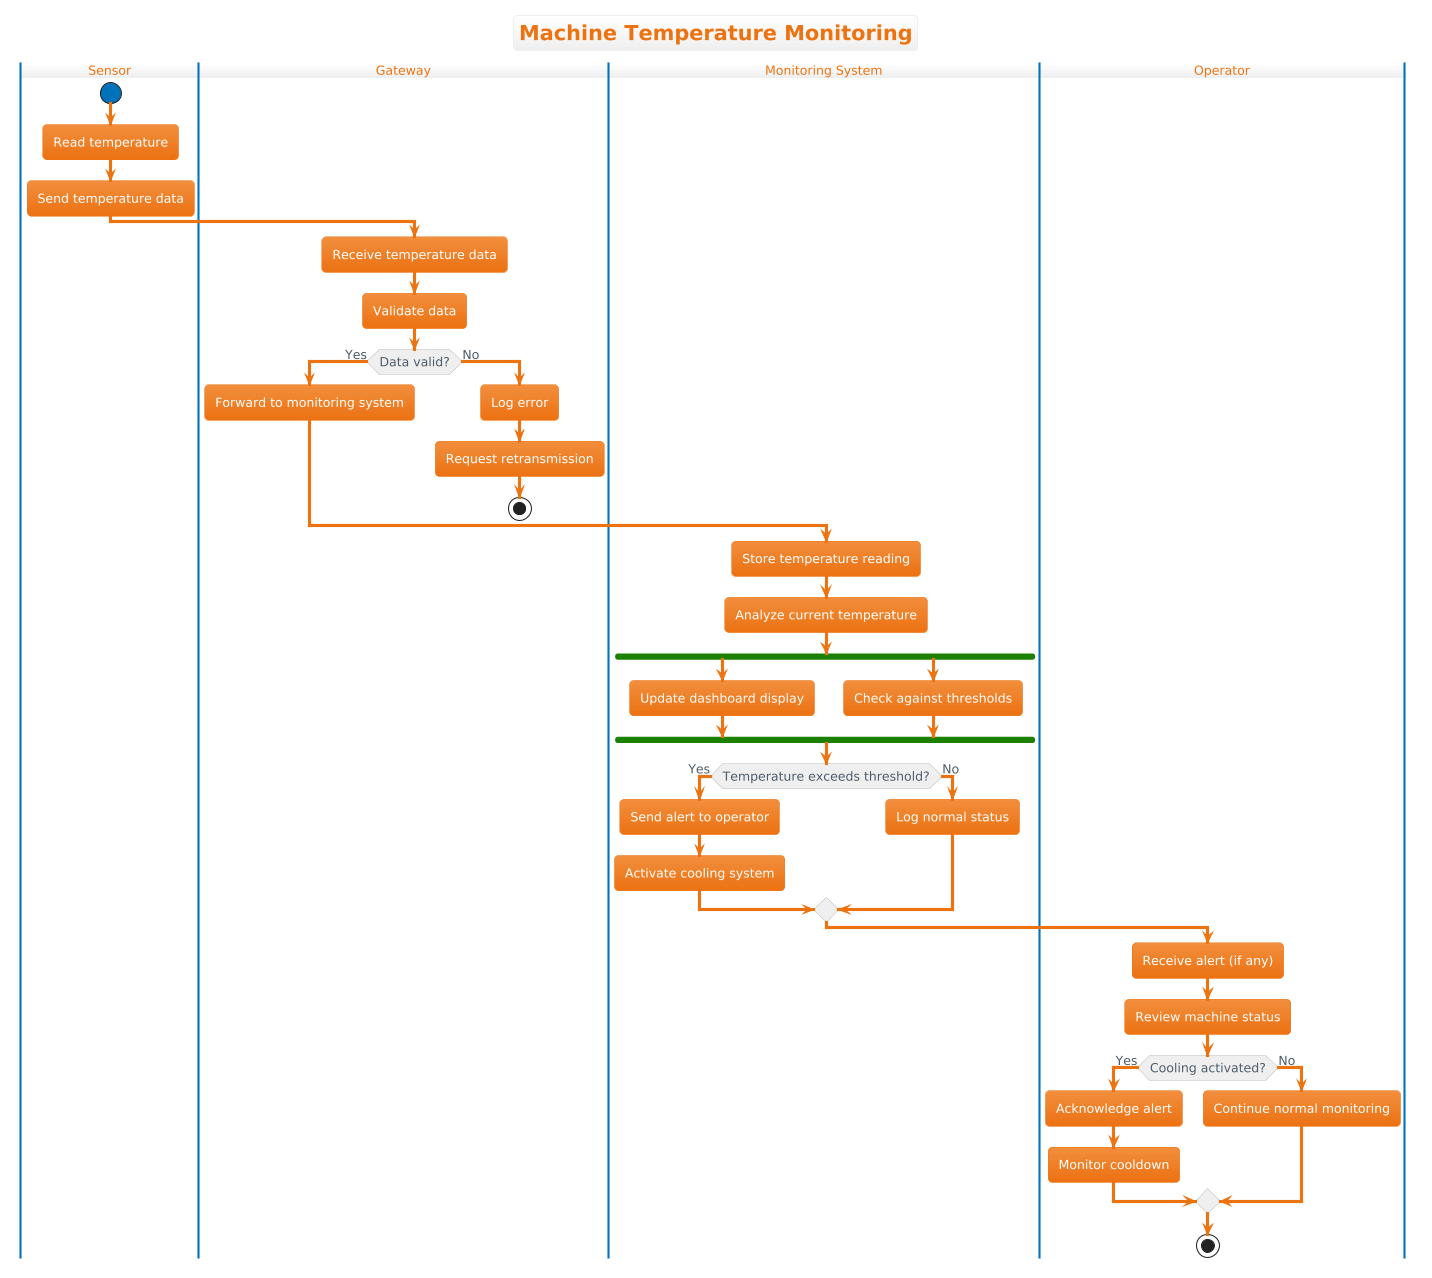
The use of swimlanes is critical here. Swimlanes partition the diagram into distinct areas, each representing a specific actor or system component. This visual separation clarifies responsibility boundaries. For example, the Sensor lane handles data acquisition, while the Operator lane handles human intervention. This prevents the diagram from becoming a tangled web of lines and makes the system architecture immediately understandable to stakeholders.
Target Domain Scope & Scenario
This model specifically addresses the monitoring loop for a single manufacturing unit. The scope includes:
- Data Acquisition: Reading raw temperature values from hardware.
- Transmission & Validation: Sending data through a network gateway and ensuring integrity.
- Processing & Analysis: Storing readings and comparing them against safety thresholds.
- Actuation & Response: Triggering cooling systems or alerts if thresholds are breached.
Dependencies exist between these components; the monitoring system cannot analyze data before the gateway validates it. The diagram captures these sequential and parallel dependencies.
Key Takeaways & Educational Insights
By following this tutorial, you will gain:
- Architectural Clarity: A visual map of how data flows from physical sensors to human operators.
- Logic Visualization: Understanding how to represent
if/elseconditions andforkpoints for parallel tasks. - Tool Proficiency: Mastery of using VPasCode to render complex PlantUML syntax without local installation.
Complete Diagram & Full Source Code
Below is the finished blueprint for the Machine Temperature Monitoring process. You can copy this code directly into the VPasCode editor to see it render instantly.
@startuml
!theme aws-orange
title Machine Temperature Monitoring

|Sensor|
start
:Read temperature;
:Send temperature data;

|Gateway|
:Receive temperature data;
:Validate data;

if (Data valid?) then (Yes)
  :Forward to monitoring system;
else (No)
  :Log error;
  :Request retransmission;
  stop
endif

|Monitoring System|
:Store temperature reading;
:Analyze current temperature;

fork
  :Update dashboard display;
fork again
  :Check against thresholds;
end fork

if (Temperature exceeds threshold?) then (Yes)
  :Send alert to operator;
  :Activate cooling system;
else (No)
  :Log normal status;
endif

|Operator|
:Receive alert (if any);
:Review machine status;

if (Cooling activated?) then (Yes)
  :Acknowledge alert;
  :Monitor cooldown;
else (No)
  :Continue normal monitoring;
endif

stop
@endumlStep-by-Step Architectural Walkthrough
Building this diagram in VPasCode is a modular process. We will break down the construction into four distinct phases to ensure clarity and maintainability.
Phase 1: Canvas Configuration & Layout Directives
Before defining the actors, we must set the visual theme and the diagram title. This ensures consistency across your documentation. In PlantUML, directives start with an exclamation mark.
We use !theme aws-orange to apply a specific color palette that mimics cloud infrastructure styling, making it suitable for IoT dashboards. The title directive provides a clear header for the rendered image.
!theme aws-orange
title Machine Temperature Monitoring
Phase 2: Declaring Core Entities, Actors, and Boundaries
The foundation of this activity diagram is the swimlane structure. Swimlanes are declared using the pipe character | followed by the name of the actor or system component. This creates vertical columns that organize the flow.
We define four primary lanes:
- Sensor: The physical device collecting data.
- Gateway: The network bridge validating data integrity.
- Monitoring System: The backend logic processing and storing data.
- Operator: The human user receiving alerts.
|Sensor|
|Gateway|
|Monitoring System|
|Operator|
Phase 3: Mapping Data Flows & Key Interactions
With the lanes established, we map the flow of control using activity nodes (rectangles) and arrows. We begin in the Sensor lane with a start node, which signifies the entry point of the process.
The flow moves to the Gateway where validation occurs. This introduces our first decision point using the if keyword. If data is invalid, the process terminates early using stop. If valid, it proceeds to the Monitoring System.
start
:Read temperature;
:Send temperature data;

if (Data valid?) then (Yes)
  :Forward to monitoring system;
else (No)
  :Log error;
  :Request retransmission;
  stop
endif
Phase 4: Grouping, Annotations & Visual Polish
The Monitoring System performs two critical tasks simultaneously: updating the dashboard and checking safety thresholds. In PlantUML, we use fork and end fork to represent parallel processing paths. This visualizes that these actions do not block each other.
Finally, the Operator lane handles the human response. Another if statement determines if the cooling system was activated, requiring different acknowledgment steps. The diagram concludes with a final stop node.
fork
  :Update dashboard display;
fork again
  :Check against thresholds;
end fork
Syntax & Keyword Deep Dive
Understanding the specific PlantUML syntax is key to mastering diagram-as-code. Here is a breakdown of the critical keywords used in this tutorial:
title: Sets the main heading for the diagram. It is a directive that appears at the top of the rendered image.|Lane|: Defines a swimlane. The text inside the pipes becomes the header for that column. All activities following it belong to that lane until a new lane is declared.start&stop: Represent the entry and exit points of the activity flow.startis typically a filled circle, andstopis a double-bordered circle.if (Condition) then (Yes) else (No) endif: The standard syntax for conditional logic. It creates a diamond shape in the diagram with branches for true and false outcomes.fork&fork again: Used to create parallel branches.forksplits the flow,fork againadds a second parallel path, andend forkmerges them back together.:Action;: The colon and semicolon syntax defines an activity node. The text between them is the label for the action box.
Best Practices & Pitfalls to Avoid
When creating activity diagrams for complex systems like IoT, adhering to best practices ensures your documentation remains useful over time.
- Maintain Consistent Abstraction Levels: Do not mix high-level business decisions with low-level code implementation details. Keep actions like
:Read temperature;at the same granularity as:Validate data;. - Use Swimlanes for Responsibility: Never crowd all logic into a single lane. Use swimlanes to clearly delineate which system or actor is responsible for each step. This prevents the “spaghetti diagram” effect.
- Limit Parallel Complexity: While
forkis powerful, too many parallel branches can confuse the reader. Use them only when actions truly happen simultaneously and independently. - Validate Logic Flow: Ensure every
ifstatement has a corresponding path tostopor the next logical step. Dead ends can indicate missing logic in your design.
Try It Yourself with VPasCode
Start Building PlantUML Activity Diagrams Faster with VPasCode
Instantly prototype your IoT workflows and render professional diagrams in your browser without installing any local tools or dependencies.