


Architectural Context: Visualizing Financial Workflows
In the high-stakes environment of investment management, clarity is currency. When a Portfolio Manager initiates a rebalancing action, it triggers a cascade of interactions across multiple systems: market data feeds, trading engines, custodial records, and internal databases. A single miscommunication in this chain can lead to compliance breaches or financial loss.
Visual modeling is not just about documentation; it is about architectural verification. Sequence diagrams provide a chronological view of these interactions, allowing architects to validate that every actor—from the human manager to the automated trading platform—performs their role within the correct temporal context.
By using PlantUML within VPasCode, finance architects can rapidly prototype these workflows. Instead of drawing static boxes in a generic editor, you write code that defines the logic, the data flow, and the conditional branching (such as whether a trade is actually required). This approach ensures your diagrams remain accurate, versionable, and instantly shareable across your team.
Understanding the Model: Purpose, Scope & Problem Framing
Before diving into the syntax, it is crucial to understand the domain abstraction we are modeling. This diagram represents a critical operational loop in an Investment Management System.
Diagram Abstraction & Representation
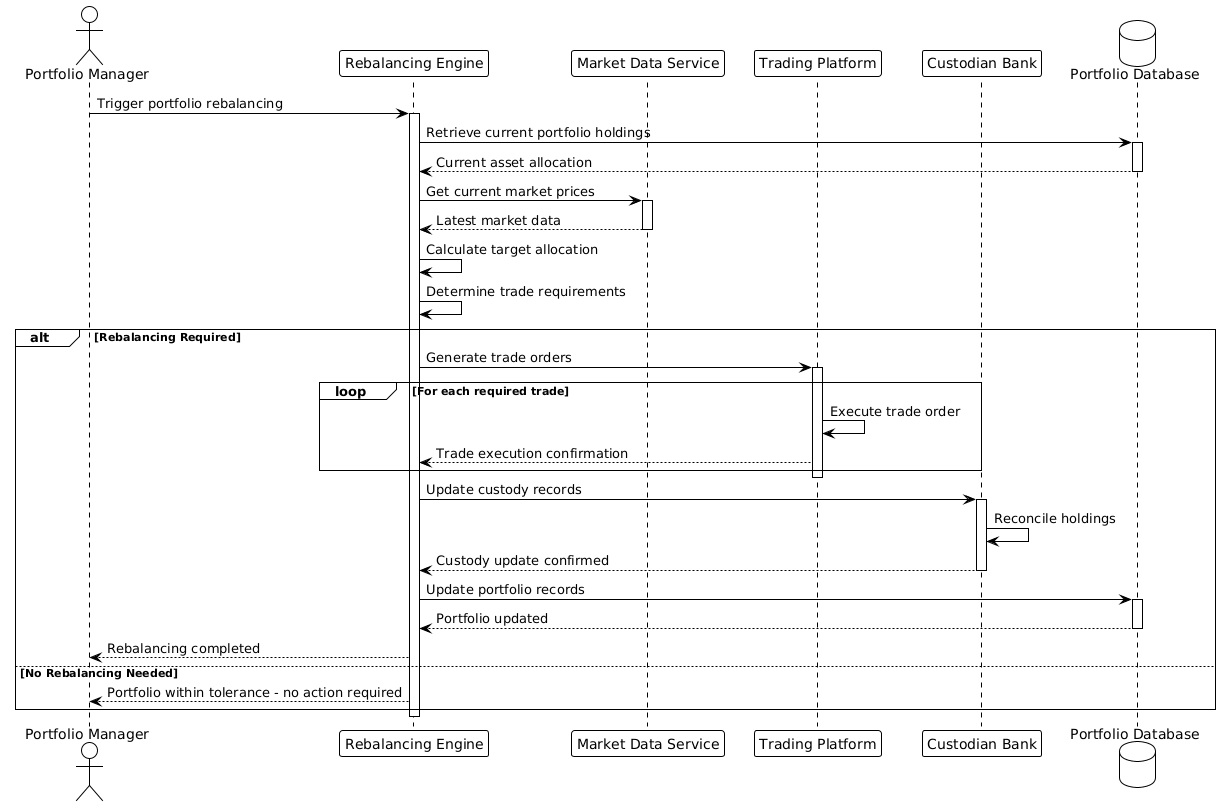
A sequence diagram models the runtime behavior of a system. In this context, it answers the question: “What happens, and in what order, when a rebalancing trigger occurs?” We use vertical lifelines to represent active participants (actors, services, databases) and horizontal arrows to represent the messages (commands, data queries, confirmations) exchanged between them. The activation bars on the lifelines indicate the period during which a participant is actively processing a task.
Target Domain Scope & Scenario
This model focuses specifically on the Portfolio Rebalancing scenario. It intentionally excludes the broader context of client onboarding or daily reporting to maintain focus on the core execution logic. The boundaries are defined by the Portfolio Manager (the initiator) and the Portfolio Database (the source of truth). The intermediate systems (Market Data, Trading Platform, Custodian) are treated as external services that must be queried and updated in a specific sequence.
Key Takeaways & Educational Insights
By studying and building this model, you will gain insight into:
- Conditional Logic in Diagrams: How to model decision points (Rebalancing Required vs. No Action) using
altblocks. - System Integration: Visualizing the handshake between internal engines and external banking infrastructure.
- State Management: Understanding how data flows from retrieval to execution to confirmation.
Complete Diagram & Full Source Code
Below is the finished blueprint for the Portfolio Rebalancing workflow. You can view the rendered diagram immediately below, followed by the complete source code.
@startuml
!theme plain

actor "Portfolio Manager" as PM
participant "Rebalancing Engine" as RE
participant "Market Data Service" as MDS
participant "Trading Platform" as TP
participant "Custodian Bank" as CB
database "Portfolio Database" as PD

PM -> RE: Trigger portfolio rebalancing
activate RE
RE -> PD: Retrieve current portfolio holdings
activate PD
PD --> RE: Current asset allocation
deactivate PD

RE -> MDS: Get current market prices
activate MDS
MDS --> RE: Latest market data
deactivate MDS

RE -> RE: Calculate target allocation
RE -> RE: Determine trade requirements

alt Rebalancing Required
    RE -> TP: Generate trade orders
    activate TP

    loop For each required trade
        TP -> TP: Execute trade order
        TP --> RE: Trade execution confirmation
    end

    deactivate TP

    RE -> CB: Update custody records
    activate CB
    CB -> CB: Reconcile holdings
    CB --> RE: Custody update confirmed
    deactivate CB

    RE -> PD: Update portfolio records
    activate PD
    PD --> RE: Portfolio updated
    deactivate PD

    RE --> PM: Rebalancing completed
else No Rebalancing Needed
    RE --> PM: Portfolio within tolerance - no action required
end

deactivate RE
@endumlStep-by-Step Architectural Walkthrough
Building this diagram requires a logical progression from setup to complex logic. We will construct this in four distinct phases.
Phase 1: Canvas Configuration & Layout Directives
Every PlantUML diagram begins with the preamble. We start by defining the theme to ensure a clean, professional look suitable for financial documentation.
!theme plain

actor "Portfolio Manager" as PM
participant "Rebalancing Engine" as RE
participant "Market Data Service" as MDS
participant "Trading Platform" as TP
participant "Custodian Bank" as CB
database "Portfolio Database" as PD
We declare the participants using specific stereotypes:
actorrepresents the human initiator (Portfolio Manager).participantrepresents software services or external APIs (Engine, Market Data, Trading, Custodian).databaseexplicitly marks persistent storage (Portfolio Database).
Phase 2: Declaring Core Entities, Actors, and Boundaries
Once the participants are defined, we establish the initial interaction. The sequence starts with the trigger from the manager to the engine.
PM -> RE: Trigger portfolio rebalancing
activate RE
RE -> PD: Retrieve current portfolio holdings
activate PD
PD --> RE: Current asset allocation
deactivate PD
Here, we see the use of activate and deactivate. These keywords draw the vertical activation bars on the lifelines, visually indicating that the Rebalancing Engine is busy processing the request while waiting for the Portfolio Database to respond. The double arrow --> indicates a return message.
Phase 3: Mapping Data Flows & Key Interactions
The engine must now make decisions based on real-world data. It queries the market and calculates the gap between current and target allocations.
RE -> MDS: Get current market prices
activate MDS
MDS --> RE: Latest market data
deactivate MDS

RE -> RE: Calculate target allocation
RE -> RE: Determine trade requirements
Note the self-referencing messages (RE -> RE). These represent internal computations performed by the engine without external communication. This is a crucial pattern for modeling logic that happens in-memory.
Phase 4: Grouping, Annotations & Visual Polish
The most complex part of this workflow is the conditional logic: Do we actually need to trade? We use the alt (alternative) block to split the flow into two paths.
alt Rebalancing Required
    RE -> TP: Generate trade orders
    activate TP

    loop For each required trade
        TP -> TP: Execute trade order
        TP --> RE: Trade execution confirmation
    end

    deactivate TP

    RE -> CB: Update custody records
    activate CB
    CB -> CB: Reconcile holdings
    CB --> RE: Custody update confirmed
    deactivate CB

    RE -> PD: Update portfolio records
    activate PD
    PD --> RE: Portfolio updated
    deactivate PD

    RE --> PM: Rebalancing completed
else No Rebalancing Needed
    RE --> PM: Portfolio within tolerance - no action required
end
The loop fragment is used inside the alt block to represent the iterative process of executing multiple trades. Finally, the else block handles the edge case where no action is needed, ensuring the system returns gracefully to the manager.
Syntax & Keyword Deep Dive
To master this notation, you must understand the specific keywords used to control the diagram’s behavior.
actor: Defines a human user or external role interacting with the system.participant: Defines a software component, service, or API endpoint.database: Defines a persistent storage entity.->(Solid Arrow): Represents a synchronous message or command sent from one participant to another.-->(Dashed Arrow): Represents a return message or response.activate/deactivate: Manually control the visibility of the activation bar on a lifeline to show when a component is processing.alt/else/end: Creates a conditional fragment. The diagram splits into branches based on the condition (e.g., Rebalancing Required vs. No Action).loop: Indicates that the enclosed interaction repeats for a set of items (e.g., iterating through a list of trades).
Best Practices & Pitfalls to Avoid
When creating financial workflows, precision is key. Follow these guidelines to ensure your diagrams are professional and maintainable.
- Keep Lifelines Focused: Each participant should represent a single responsibility. Avoid merging the “Trading Platform” and “Custodian Bank” into one box unless they are strictly coupled in your architecture.
- Use
altBlocks for Branching: Never hide logic inside a single message. If a system might fail, or if a condition changes the outcome (like thealtblock in this tutorial), explicitly model both paths. - Label Your Messages: Use descriptive text for arrows (e.g., “Generate trade orders” instead of “Send data”). This turns the diagram into documentation, not just a sketch.
- Manage Visual Complexity: If a sequence becomes too long, consider splitting it into multiple diagrams (e.g., “Rebalancing Logic” vs. “Trade Execution”) to maintain readability.
Try It Yourself with VPasCode
Start Building Sequence Diagrams Faster with VPasCode
Design complex financial workflows with instant live browser preview, zero local installation, and interactive syntax testing.