


In the complex ecosystem of modern logistics, the final leg of delivery—often called the last mile—represents the most critical and costly segment of the supply chain. Architects designing systems for this domain must balance real-time routing calculations, fleet availability, and customer visibility without creating a tangled web of dependencies. Visualizing this architecture is not merely a documentation exercise; it is a strategic necessity to ensure that microservices like order processing, route optimization, and telematics can communicate efficiently. A well-structured component diagram provides the blueprint needed to decouple these services, allowing teams to iterate on specific domains like fleet dispatch without risking the stability of the entire logistics network.
Using diagram-as-code tools like VPasCode transforms this architectural planning into a precise, executable process. Unlike static drawing tools, VPasCode allows you to define the structural relationships between your services using PlantUML, ensuring that the visual representation matches the intended technical implementation. By leveraging VPasCode, you can instantly render complex interaction models, verify interface contracts, and share living documentation with stakeholders. This approach eliminates the friction of manual diagramming, allowing you to focus on the logic of your system rather than the placement of shapes.
Understanding the Model: Purpose, Scope & Problem Framing
This tutorial focuses on constructing a Component Diagram for a Last-Mile Delivery Routing System. In the context of software architecture, a component diagram is the ideal tool for modeling the physical or logical building blocks of a system and the relationships between them. It answers critical questions about system boundaries: which services provide capabilities, which services require them, and how they connect.
Diagram Abstraction & Representation
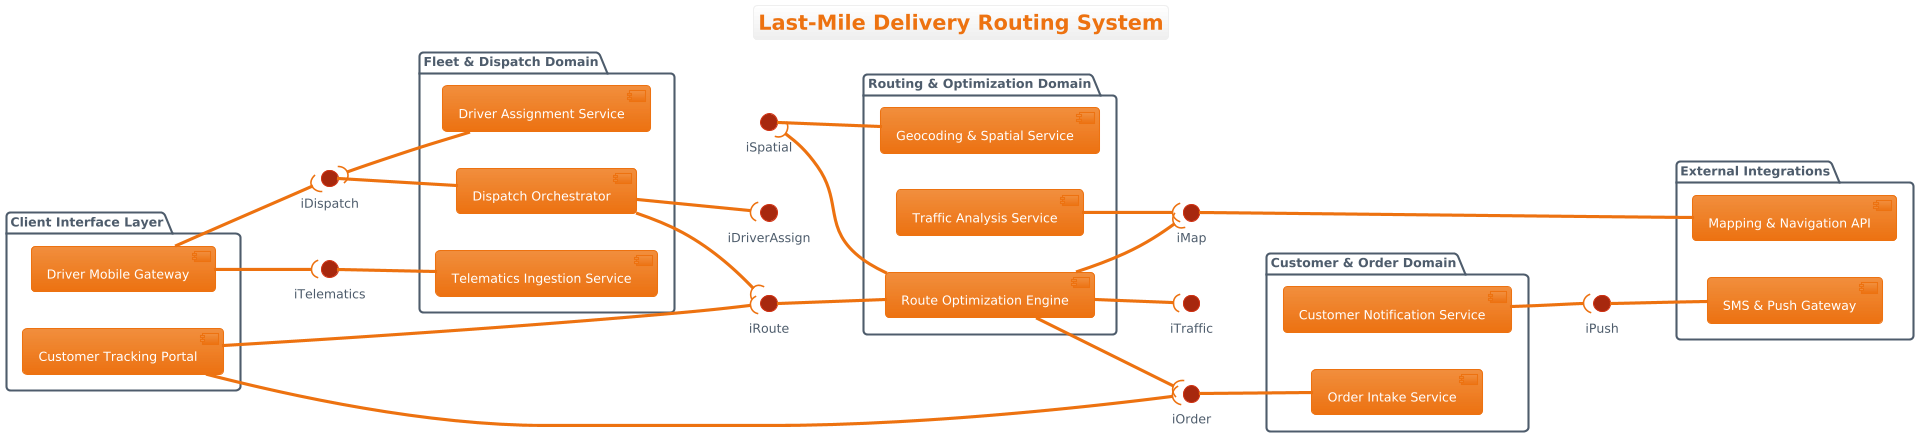
The model specifically visualizes the microservices architecture of a logistics platform. It abstracts away implementation details like database tables or specific programming languages, focusing instead on the contractual interfaces that services expose. The ball-and-socket notation is used to clearly distinguish between Provided Interfaces (what a component offers) and Required Interfaces (what a component needs to function). This distinction is vital for understanding dependency directionality in a distributed system.
Target Domain Scope & Scenario
The scope covers the core operational loop of a delivery service. It includes the Customer & Order Domain for intake and notifications, the Routing & Optimization Domain for calculating paths, the Fleet & Dispatch Domain for managing drivers, and the Client Interface Layer for user-facing applications. External integrations like Mapping APIs are modeled as separate packages to highlight third-party dependencies.
Key Takeaways & Educational Insights
By completing this guide, you will gain insights into how to group components logically using packages, how to define interface contracts using PlantUML syntax, and how to maintain visual clarity in complex enterprise diagrams. You will learn to separate concerns architecturally, ensuring that the Routing Engine does not directly couple with the Driver Mobile Gateway, but rather interacts through defined service boundaries.
Complete Diagram & Full Source Code
Before diving into the construction phases, review the finished blueprint. This diagram demonstrates a clean separation of concerns across five distinct architectural domains, connected via explicit interface contracts.
@startuml
!theme aws-orange
left to right direction

title Last-Mile Delivery Routing System

/'
  This comprehensive component diagram models the enterprise architecture for a Last-Mile Delivery Routing System.
  It highlights the decoupling of microservices across order processing, dynamic route calculation,
  fleet dispatch, telemetry tracking, and external third-party navigation providers via ball-and-socket interfaces.
'/

package "Customer & Order Domain" {
  [Order Intake Service] as OrderIntake
  [Customer Notification Service] as NotifSvc
}

package "Routing & Optimization Domain" {
  [Route Optimization Engine] as RouteEngine
  [Geocoding & Spatial Service] as SpatialSvc
  [Traffic Analysis Service] as TrafficSvc
}

package "Fleet & Dispatch Domain" {
  [Dispatch Orchestrator] as DispatchCore
  [Driver Assignment Service] as DriverAssign
  [Telematics Ingestion Service] as TelematicsSvc
}

package "Client Interface Layer" {
  [Driver Mobile Gateway] as MobileGateway
  [Customer Tracking Portal] as TrackingPortal
}

package "External Integrations" {
  [Mapping & Navigation API] as MapAPI
  [SMS & Push Gateway] as PushAPI
}

' Provided Interfaces (interface on the left)
iOrder -- OrderIntake
iSpatial -- SpatialSvc
iRoute -- RouteEngine
iDispatch -- DispatchCore
iTelematics -- TelematicsSvc
iMap -- MapAPI
iPush -- PushAPI

' Required Interfaces (interface on the right using --() )
RouteEngine --( iOrder
RouteEngine --( iSpatial
RouteEngine --( iMap
RouteEngine --( iTraffic
TrafficSvc --( iMap
DispatchCore --( iRoute
DispatchCore --( iDriverAssign
DriverAssign --( iDispatch
MobileGateway --( iDispatch
MobileGateway --( iTelematics
TrackingPortal --( iOrder
TrackingPortal --( iRoute
NotifSvc --( iPush

@endumlStep-by-Step Architectural Walkthrough
Constructing this diagram in VPasCode is a systematic process. We will break the creation down into four logical phases: canvas configuration, domain declaration, interface mapping, and visual polish.
Phase 1: Canvas Configuration & Layout Directives
Every diagram starts with global settings that define how the renderer interprets the code. In this example, we prioritize readability and a specific visual theme.
!theme aws-orange
left to right direction
The !theme aws-orange directive applies a consistent color palette that aligns with enterprise cloud standards, making the diagram look professional immediately. The left to right direction directive ensures that the flow of the architecture reads naturally from the entry points (Customer Domain) to the backend services (Fleet & Dispatch) and external dependencies.
Phase 2: Declaring Core Entities, Actors, and Boundaries
The next step is to define the structural boundaries of the system. We use package blocks to group related components. This prevents the diagram from becoming a flat list of services and instead creates a hierarchical view of the architecture.
package "Customer & Order Domain" {
  [Order Intake Service] as OrderIntake
  [Customer Notification Service] as NotifSvc
}

package "Routing & Optimization Domain" {
  [Route Optimization Engine] as RouteEngine
}
Each component is defined using square brackets [Component Name] followed by the as Alias keyword. Using aliases (like OrderIntake) is crucial for referencing these components later in the interface connection lines without repeating long names.
Phase 3: Mapping Data Flows & Key Interactions
With the components declared, we define how they interact. In PlantUML component diagrams, interaction is defined via interfaces. A Provided Interface is what a component offers to others, while a Required Interface is what a component needs from others.
iOrder -- OrderIntakeThe syntax iOrder -- OrderIntake indicates that OrderIntake provides the iOrder interface. The ball-and-socket visual is generated automatically. For required interfaces, we use the --( syntax to place the interface on the right side of the component.
RouteEngine --( iOrderThis line specifies that RouteEngine requires the iOrder interface. Notice the component is on the left and the interface on the right. This visual distinction helps reviewers quickly identify dependencies versus services.
Phase 4: Grouping, Annotations & Visual Polish
Finally, we add context to the diagram to ensure it is self-explanatory. We use a comment block to provide a high-level description of the system’s purpose.
/'
  This comprehensive component diagram models the enterprise architecture...
'/

title Last-Mile Delivery Routing System
The comment syntax /\' ... '/ allows for multi-line text that does not render as a shape but provides metadata or context. The title directive places a clear header at the top of the diagram, essential for documentation and embedding.
Syntax & Keyword Deep Dive
To master diagram-as-code, you must understand the specific keywords that drive the rendering engine. Here is a breakdown of the critical PlantUML syntax used in this logistics model.
!theme: Defines the global visual style. VPasCode supports various themes likeaws-orange,black-architect, etc., to match your organization’s branding.left to right direction: Controls the orthogonal flow of the diagram. Alternatives includetop to bottom direction.package: Creates a container to group components. This is essential for managing complexity in large systems.[Component Name]: The standard syntax for defining a component shape. The text inside the brackets is the label.interfaceAlias -- componentAlias: Defines a Provided Interface. The interface appears on the left (ball), and the component on the right (socket).componentAlias --( interfaceAlias: Defines a Required Interface. The component appears on the left (socket), and the interface on the right (ball)./' ... '/: Multi-line comment syntax. Text inside is not rendered as a diagram element but is available in the source code.
Best Practices & Pitfalls to Avoid
Creating clear, maintainable diagrams requires adherence to specific modeling standards. Follow these guidelines to ensure your VPasCode diagrams remain useful over time.
- Keep Interfaces Atomic: Avoid bundling too many functions into a single interface. If a service provides both “Order” and “Tracking” capabilities, consider splitting them into
iOrderandiTrackingfor better granularity. - Consistent Naming Conventions: Use clear, consistent naming for aliases. If you use
OrderIntakefor a component, ensure the interface is namediOrderto maintain semantic clarity. - Manage Visual Complexity: If a diagram becomes too crowded, split it into multiple views. For example, separate the “Client Interface Layer” from the “Backend Domain” into different diagrams if the relationship map becomes too dense.
- Use Descriptive Comments: Always include a comment block at the top of your code explaining the scope. This helps new team members understand the diagram’s intent without reading the code line-by-line.
Start Building Last-Mile Delivery Diagrams Faster with VPasCode
Instantly render and customize your logistics architecture online with VPasCode. No tools to install, just write code and see the results immediately.