


In the fast-paced world of logistics and supply chain management, clarity is currency. When a Transportation Management System (TMS) orchestrates the complex dance of sourcing freight, understanding the precise flow of data between internal engines and external carrier partners is vital. A single misstep in the rate calculation logic can lead to costly billing errors or service failures. Visual modeling bridges the gap between abstract requirements and concrete implementation, allowing architects to validate logic before writing a single line of production code.
This tutorial demonstrates how to model a critical carrier rate quote request scenario using PlantUML within VPasCode. By leveraging a diagram-as-code approach, teams can maintain living documentation that evolves alongside the software. VPasCode provides a free, web-based environment where you can write, render, and refine these diagrams instantly without the friction of local environment setup.

Understanding the Model: Purpose, Scope & Problem Framing
Before diving into syntax, it is essential to understand the architectural abstraction being modeled. A sequence diagram is the ideal tool for this scenario because it captures time-ordered interactions between system components. Unlike a static flowchart, a sequence diagram emphasizes the temporal aspect of the request: when messages are sent, how long components stay active, and how parallel processing impacts the overall response time.
Diagram Abstraction & Representation
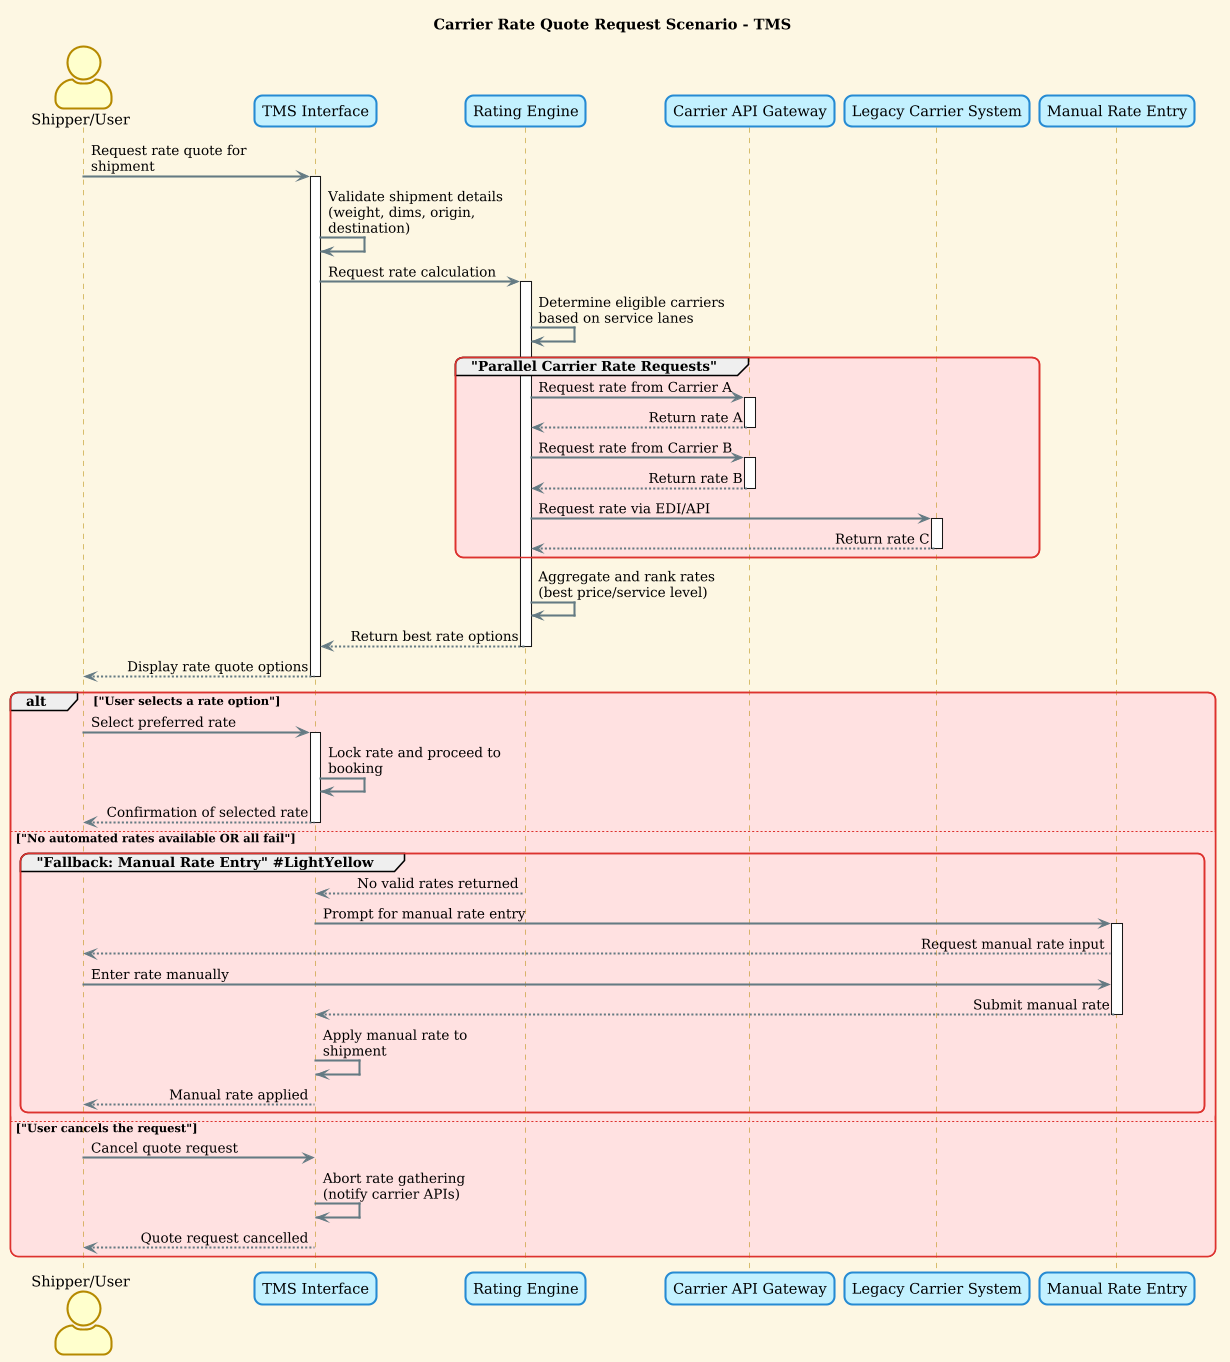
The diagram models the lifecycle of a rate quote request. It distinguishes between synchronous requests (User to TMS) and asynchronous or parallel responses (Rating Engine to multiple Carriers). It also explicitly defines the boundaries of automation versus manual intervention, a crucial distinction in logistics systems where carrier API availability fluctuates.
Target Domain Scope & Scenario
This model focuses specifically on the Rating Engine workflow within a TMS. It excludes order creation or billing settlement, focusing strictly on the decision-making phase where rates are gathered, aggregated, and presented to the user. The scope includes the primary automated path, parallel carrier lookups, and the fallback mechanism for manual entry.
Key Takeaways & Educational Insights
By constructing this model, you will gain insights into handling parallel processing in sequence diagrams, managing alternative flows using combined fragments, and visualizing system resilience when external dependencies fail.
Complete Diagram & Full Source Code
Below is the complete blueprint for the Carrier Rate Quote Request scenario. This diagram utilizes the sunlust theme for a modern aesthetic and includes combined fragments to handle alternative logic paths.
@startuml

!theme sunlust

title Carrier Rate Quote Request Scenario - TMS

/'
This sequence diagram illustrates the carrier rate quote request process
within a Transportation Management System (TMS). It covers the interaction
between the TMS, internal rating engine, external carrier APIs, and the
optional fallback to a manual rate entry flow when automated quotes fail
or are unavailable.
'/

actor "Shipper/User" as User
participant "TMS Interface" as TMS
participant "Rating Engine" as RatingEngine
participant "Carrier API Gateway" as CarrierAPI
participant "Legacy Carrier System" as LegacyCarrier
participant "Manual Rate Entry" as ManualEntry

User -> TMS: Request rate quote for shipment
activate TMS

TMS -> TMS: Validate shipment details\n(weight, dims, origin, destination)
TMS -> RatingEngine: Request rate calculation
activate RatingEngine

RatingEngine -> RatingEngine: Determine eligible carriers\nbased on service lanes

group "Parallel Carrier Rate Requests"
    RatingEngine -> CarrierAPI: Request rate from Carrier A
    activate CarrierAPI
    CarrierAPI --> RatingEngine: Return rate A
    deactivate CarrierAPI

    RatingEngine -> CarrierAPI: Request rate from Carrier B
    activate CarrierAPI
    CarrierAPI --> RatingEngine: Return rate B
    deactivate CarrierAPI

    RatingEngine -> LegacyCarrier: Request rate via EDI/API
    activate LegacyCarrier
    LegacyCarrier --> RatingEngine: Return rate C
    deactivate LegacyCarrier
end

RatingEngine -> RatingEngine: Aggregate and rank rates\n(best price/service level)
RatingEngine --> TMS: Return best rate options
deactivate RatingEngine

TMS --> User: Display rate quote options
deactivate TMS

alt "User selects a rate option"
    User -> TMS: Select preferred rate
    activate TMS
    TMS -> TMS: Lock rate and proceed to booking
    TMS --> User: Confirmation of selected rate
    deactivate TMS

else "No automated rates available OR all fail"
    group "Fallback: Manual Rate Entry" #LightYellow
        RatingEngine --> TMS: No valid rates returned
        TMS -> ManualEntry: Prompt for manual rate entry
        activate ManualEntry
        ManualEntry --> User: Request manual rate input
        User -> ManualEntry: Enter rate manually
        ManualEntry --> TMS: Submit manual rate
        deactivate ManualEntry
        TMS -> TMS: Apply manual rate to shipment
        TMS --> User: Manual rate applied
    end

else "User cancels the request"
    User -> TMS: Cancel quote request
    TMS -> TMS: Abort rate gathering\n(notify carrier APIs)
    TMS --> User: Quote request cancelled
end

@endumlStep-by-Step Architectural Walkthrough
Building a professional diagram requires a structured approach. We will deconstruct this PlantUML model into four logical phases, ensuring you understand not just the syntax, but the architectural intent behind each line.
Phase 1: Canvas Configuration & Layout Directives
Every PlantUML diagram begins with configuration directives that set the stage. In this tutorial, we start with @startuml to initialize the diagram. We then apply the !theme sunlust directive, which instantly applies a specific color palette and styling to the entire diagram, ensuring it looks professional without manual CSS tweaking.
Next, we define the title and the comment block. The comment block, wrapped in /' and '/, provides essential context for anyone reading the diagram later. This is particularly useful for documentation standards where diagrams must stand alone.
Phase 2: Declaring Core Entities, Actors, and Boundaries
The foundation of a sequence diagram is its participants. We use actor for external human users and participant for internal system components. Notice how we assign aliases using the as keyword (e.g., as User). This allows us to reference components by short names later in the diagram, keeping the syntax clean and readable.
actor "Shipper/User" as User
participant "TMS Interface" as TMS
We also introduce specialized participants like LegacyCarrier and ManualEntry. These represent edge cases or specific integrations that are critical to the logistics workflow but distinct from the primary API gateway.
Phase 3: Mapping Data Flows & Key Interactions
With actors declared, we map the flow of messages. Solid arrows (->) denote synchronous requests, while dashed arrows (-->) denote responses. We use activate and deactivate to draw activation bars on the lifelines, visually indicating when a component is busy processing a request.
TMS -> TMS: Validate shipment details\n(weight, dims, origin, destination)
A key feature here is the group directive. We wrap the carrier API calls in a group labeled “Parallel Carrier Rate Requests”. This visually communicates to the reader that these three requests happen concurrently, rather than sequentially, which is a common pattern in modern microservices architectures.
Phase 4: Grouping, Annotations & Visual Polish
The final phase handles complex logic flows. We use the alt and else keywords to represent conditional logic. This allows us to show the happy path (User selects a rate) alongside failure paths (No rates available) and cancellation flows within a single diagram.
We also apply visual styling to the fallback group using #LightYellow to highlight the manual entry process. This visual cue helps stakeholders quickly identify where human intervention is required, which is a best practice for system reliability documentation.
Syntax & Keyword Deep Dive
Understanding the specific PlantUML keywords used in this diagram empowers you to extend this model for other scenarios. Below is a breakdown of the critical syntax elements:
!theme sunlust: A directive that applies a predefined visual theme. This ensures consistency across your documentation without manual styling.actor&participant: Defines the lifelines.actortypically represents a human or external system, whileparticipantrepresents a software component.->&-->: The standard arrow syntax. Solid lines indicate a call/request, and dashed lines indicate a return/response.activate&deactivate: Controls the vertical activation bar. This is crucial for visualizing processing time and concurrency.group: Creates a rectangular frame around a set of messages. In this diagram, it emphasizes parallel execution.alt&else: Creates conditional blocks.altdefines the primary condition, andelsedefines the alternative paths (e.g., failure or cancellation)./' ... '/: The comment syntax for PlantUML. This text does not render in the diagram but is preserved in the source for documentation.
Best Practices & Pitfalls to Avoid
To ensure your diagrams remain maintainable and readable over time, adhere to these modeling best practices:
- Modularize Complex Logic: If a sequence diagram becomes too crowded, consider splitting it into multiple diagrams (e.g., one for the happy path, one for error handling). However, for scenarios like this where the fallback is critical to the flow, keeping it in one diagram with
altblocks is acceptable. - Consistent Naming Conventions: Always use descriptive names for actors and participants. Avoid abbreviations like
TMSunless defined clearly. Use theaskeyword to create short aliases for readability. - Visual Hierarchy: Use
groupand color tags (like#LightYellow) to draw attention to critical paths or deviations. This helps stakeholders focus on risk areas like manual entry. - Manage Abstraction Levels: Do not model every internal method call. Stick to logical boundaries (e.g.,
Request rate calculationinstead ofcalculateRate()) to keep the diagram high-level and understandable.
Try It Yourself with VPasCode
Start Building PlantUML Diagrams Faster with VPasCode
Instantly render and customize this carrier rate quote sequence diagram online in VPasCode without installing any tools.