


In the rapidly evolving landscape of modern energy infrastructure, Smart Grid Monitoring Systems serve as the central nervous system for power distribution. These systems rely on real-time data ingestion from thousands of sensors to maintain stability, detect faults, and ensure reliability. However, as the complexity of these networks grows, so does the difficulty of documenting the workflows that govern them.

Visualizing the Outage Detection Process is not merely a documentation exercise; it is a critical architectural necessity. Engineers must clearly define how data flows from sensors to decision logic, how parallel processing handles multiple data streams, and how human operators intervene when automated thresholds are breached. Traditional drawing tools often result in static diagrams that become outdated the moment the code changes. By adopting a diagram-as-code approach with PlantUML, energy architects can create living documentation that evolves alongside their systems.
This tutorial demonstrates how to build a professional-grade activity diagram for an outage detection workflow using VPasCode. We will leverage swimlanes to separate automated system logic from human operator responsibilities, incorporate parallel processing for efficiency, and implement robust conditional branching to handle edge cases like false alarms.
Understanding the Model: Purpose, Scope & Problem Framing
Diagram Abstraction & Representation
An Activity Diagram in PlantUML is the ideal tool for modeling the dynamic behavior of a system. Unlike static class diagrams, activity diagrams capture the flow of control and data. In the context of a Smart Grid, this diagram represents the lifecycle of an incident: from the initial ingestion of sensor telemetry to the final dispatch of a field crew.
Key modeling abstractions used here include:
- Swimlanes: These partition the diagram into logical domains (e.g.,
|System|vs.|Operator|). This clarifies responsibility boundaries, ensuring developers know which logic is automated and which requires human intervention. - Decision Points (Diamonds): Represented by
ifstatements, these model the critical decision logic where the system branches based on data states (e.g., Is anomaly detected?). - Forks & Joins: These capture parallel processing, allowing the system to perform multiple independent checks (like correlating data and checking communication status) simultaneously.
Target Domain Scope & Scenario
This model focuses specifically on the Outage Detection phase of the Smart Grid lifecycle. It does not cover the full restoration process in detail but stops once the field crew is dispatched. The scope includes:
- Input: Real-time voltage and frequency data from grid sensors.
- Processing: Automated anomaly detection and validation protocols.
- Output: Operator alerts and crew dispatch instructions.
By isolating this specific workflow, we ensure the diagram remains maintainable and focused on the critical path of fault detection.
Key Takeaways & Educational Insights
By the end of this guide, you will gain the ability to:
- Visualize System Boundaries: Understand how to use swimlanes to distinguish between backend automation and frontend human operations.
- Implement Parallel Logic: Learn how to use
forkandfork againto model concurrent system tasks efficiently. - Handle Edge Cases: See how to model negative paths (e.g., false alarms) to ensure robust system behavior documentation.
Complete Diagram & Full Source Code
Below is the completed blueprint for the Smart Grid Outage Detection Process. This diagram utilizes the VP theme for a clean, professional look and incorporates swimlanes, parallel flows, and conditional logic.
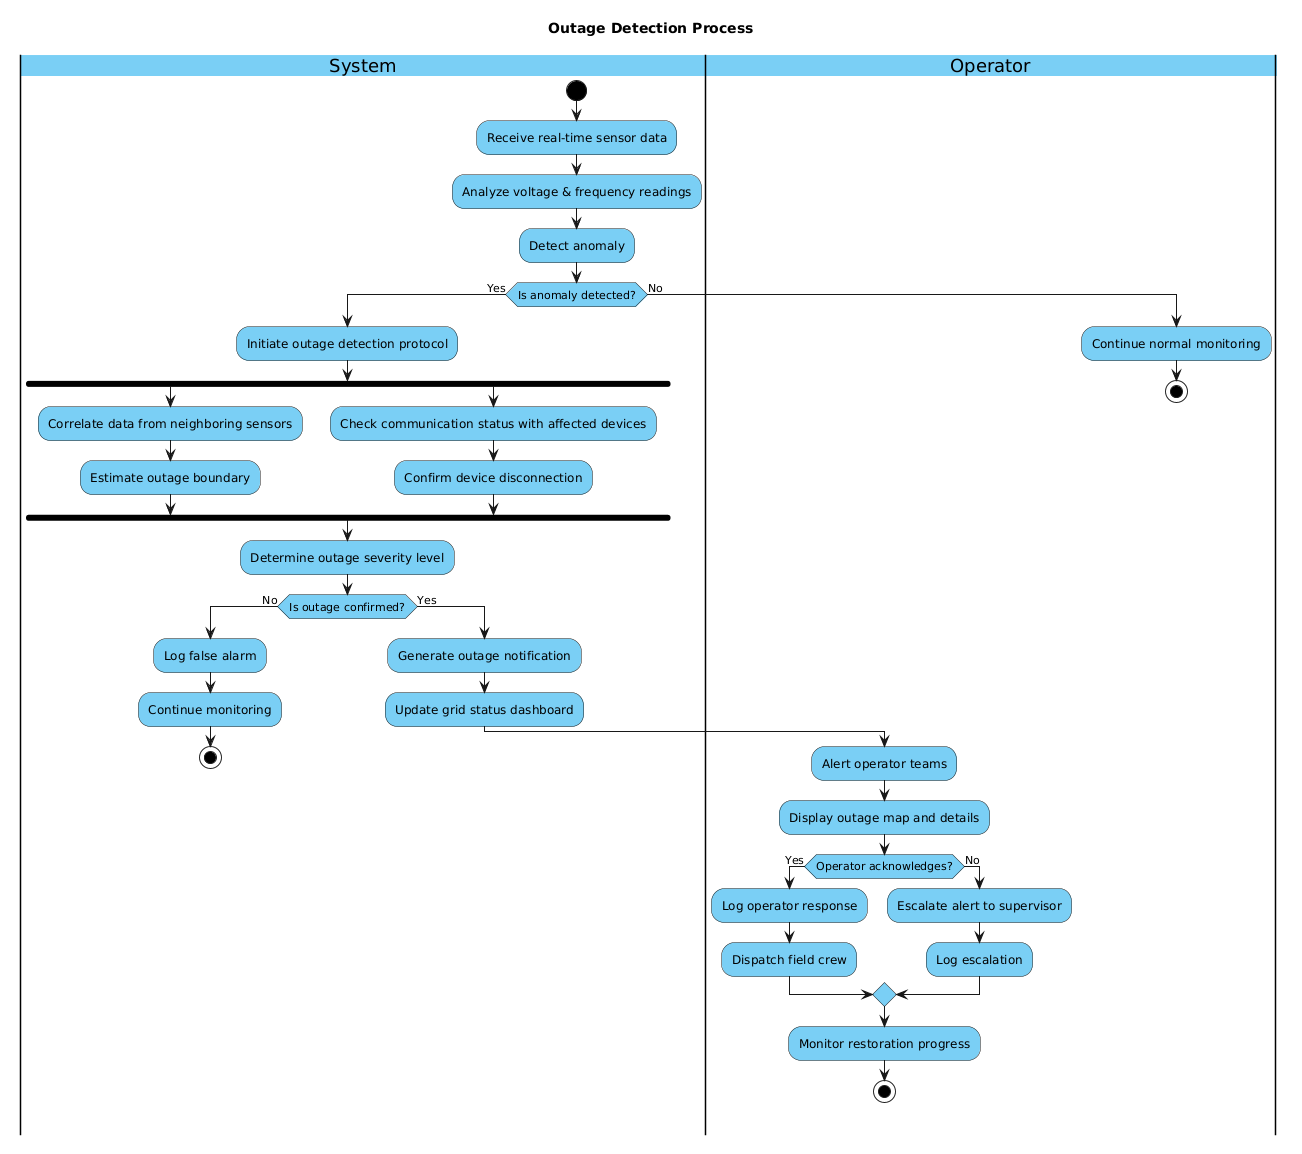
Copy the following complete source code to test and render this diagram instantly in the VPasCode editor:
@startuml
!include https://static.visual-paradigm.com/web/resources/plantuml-stdlib/themes/vp.puml

title Outage Detection Process

|System|
start
:Receive real-time sensor data;
:Analyze voltage & frequency readings;
:Detect anomaly;

|System|
if (Is anomaly detected?) then (Yes)
  :Initiate outage detection protocol;
  |System|
  fork
    :Correlate data from neighboring sensors;
    :Estimate outage boundary;
  fork again
    :Check communication status with affected devices;
    :Confirm device disconnection;
  end fork
  |System|
  :Determine outage severity level;
  if (Is outage confirmed?) then (No)
    :Log false alarm;
    :Continue monitoring;
    stop
  else (Yes)
    |System|
    :Generate outage notification;
    :Update grid status dashboard;
    |Operator|
    :Alert operator teams;
    :Display outage map and details;
    |Operator|
    if (Operator acknowledges?) then (Yes)
      :Log operator response;
      :Dispatch field crew;
    else (No)
      :Escalate alert to supervisor;
      :Log escalation;
    endif
    :Monitor restoration progress;
    stop
  endif
else (No)
  :Continue normal monitoring;
  stop
endif

@endumlStep-by-Step Architectural Walkthrough
Phase 1: Canvas Configuration & Layout Directives
Every professional PlantUML diagram begins with configuration directives that set the visual style and scope. We start by including the VP theme, which provides a modern, clean aesthetic suitable for enterprise documentation.
!include https://static.visual-paradigm.com/web/resources/plantuml-stdlib/themes/vp.puml

title Outage Detection Process
The !include directive pulls in the theme definitions, while the title keyword ensures the diagram has a clear, descriptive header that appears at the top of the rendered output.
Phase 2: Declaring Core Entities, Actors, and Boundaries
To maintain clarity in complex workflows, we use Swimlanes. Swimlanes visually separate responsibilities. In this diagram, we define two primary domains: the System (automated logic) and the Operator (human intervention).
|System|
start
:Receive real-time sensor data;
:Analyze voltage & frequency readings;
Here, |System| acts as a container. Any activity defined after this tag belongs to the automated backend until a new swimlane tag (like |Operator|) is encountered. This immediately tells the reader that the initial data ingestion is an automated process.
Phase 3: Mapping Data Flows & Key Interactions
The core logic of the diagram revolves around decision points and state transitions. We begin with the standard start node and move into the first processing block.
if (Is anomaly detected?) then (Yes)
  :Initiate outage detection protocol;
The if statement creates a diamond shape in the diagram. The text inside the parentheses (Is anomaly detected?) becomes the decision question, while then (Yes) defines the label for the positive branch. This structure allows the diagram to represent the branching paths of the system’s logic clearly.
Phase 4: Grouping, Annotations & Visual Polish
For high-performance systems, parallel processing is often required. We use the fork and fork again keywords to split the flow into concurrent threads that execute simultaneously.
fork
  :Correlate data from neighboring sensors;
  :Estimate outage boundary;
fork again
  :Check communication status with affected devices;
  :Confirm device disconnection;
end fork
The fork keyword opens a parallel block, and fork again adds a second concurrent path. The end fork keyword ensures all parallel threads converge back into a single flow before proceeding to the next step (e.g., :Determine outage severity level;). This accurately models how the system processes multiple data streams without waiting for one to finish before starting another.
Syntax & Keyword Deep Dive
To master PlantUML activity diagrams, it is essential to understand the specific keywords used in this workflow. Below is a breakdown of the critical syntax elements:
start/stop: Define the entry and exit points of the activity flow. Every diagram must begin withstartand end withstopto ensure valid graph topology.|LaneName|: Declares a swimlane. All activities following this tag are grouped under that specific domain until a new lane tag is found.if (Condition) then (Branch): Creates a decision node. The condition text is displayed inside the diamond, and the branch text labels the outgoing path.fork/fork again/end fork: Implements parallel processing.forkstarts the first parallel branch,fork againadds additional concurrent branches, andend forkmerges them back into a single flow.:Action;: Defines a process step. The text inside the colon represents the activity description.
Best Practices & Pitfalls to Avoid
When creating activity diagrams for critical infrastructure like Smart Grids, follow these best practices to ensure your diagrams remain effective and maintainable:
- Maintain Swimlane Clarity: Do not mix automated logic with human tasks in the same lane unless they are tightly coupled. Keep
|System|and|Operator|distinct to avoid confusion about who (or what) performs the action. - Handle False Positives: Always model the negative path. In this diagram, the
else (No)branch forIs outage confirmed?handles false alarms. Skipping this makes the diagram incomplete and potentially misleading. - Keep Flows Linear Where Possible: While parallel processing is powerful, overusing
forkcan make the diagram hard to read. Only use parallelism when tasks are truly independent (e.g., checking data vs. checking communication). - Use Descriptive Labels: Avoid vague labels like
Process Data. Instead, use specific actions likeAnalyze voltage & frequency readings. This makes the diagram a useful reference for developers.
Try It Yourself with VPasCode
Start Building PlantUML Activity Diagrams Faster with VPasCode
Test, preview, and customize this Smart Grid outage detection workflow instantly in your browser without installing any tools.