


In the rapidly evolving energy sector, Smart Metering Systems serve as the critical backbone for modern utility management. These devices do not merely measure consumption; they facilitate a complex digital workflow where data is collected, validated, encrypted, and processed to generate accurate billing cycles. For software architects and system engineers in the energy industry, documenting these workflows is not just a bureaucratic exercise—it is a necessity for ensuring data integrity, security compliance, and operational efficiency.
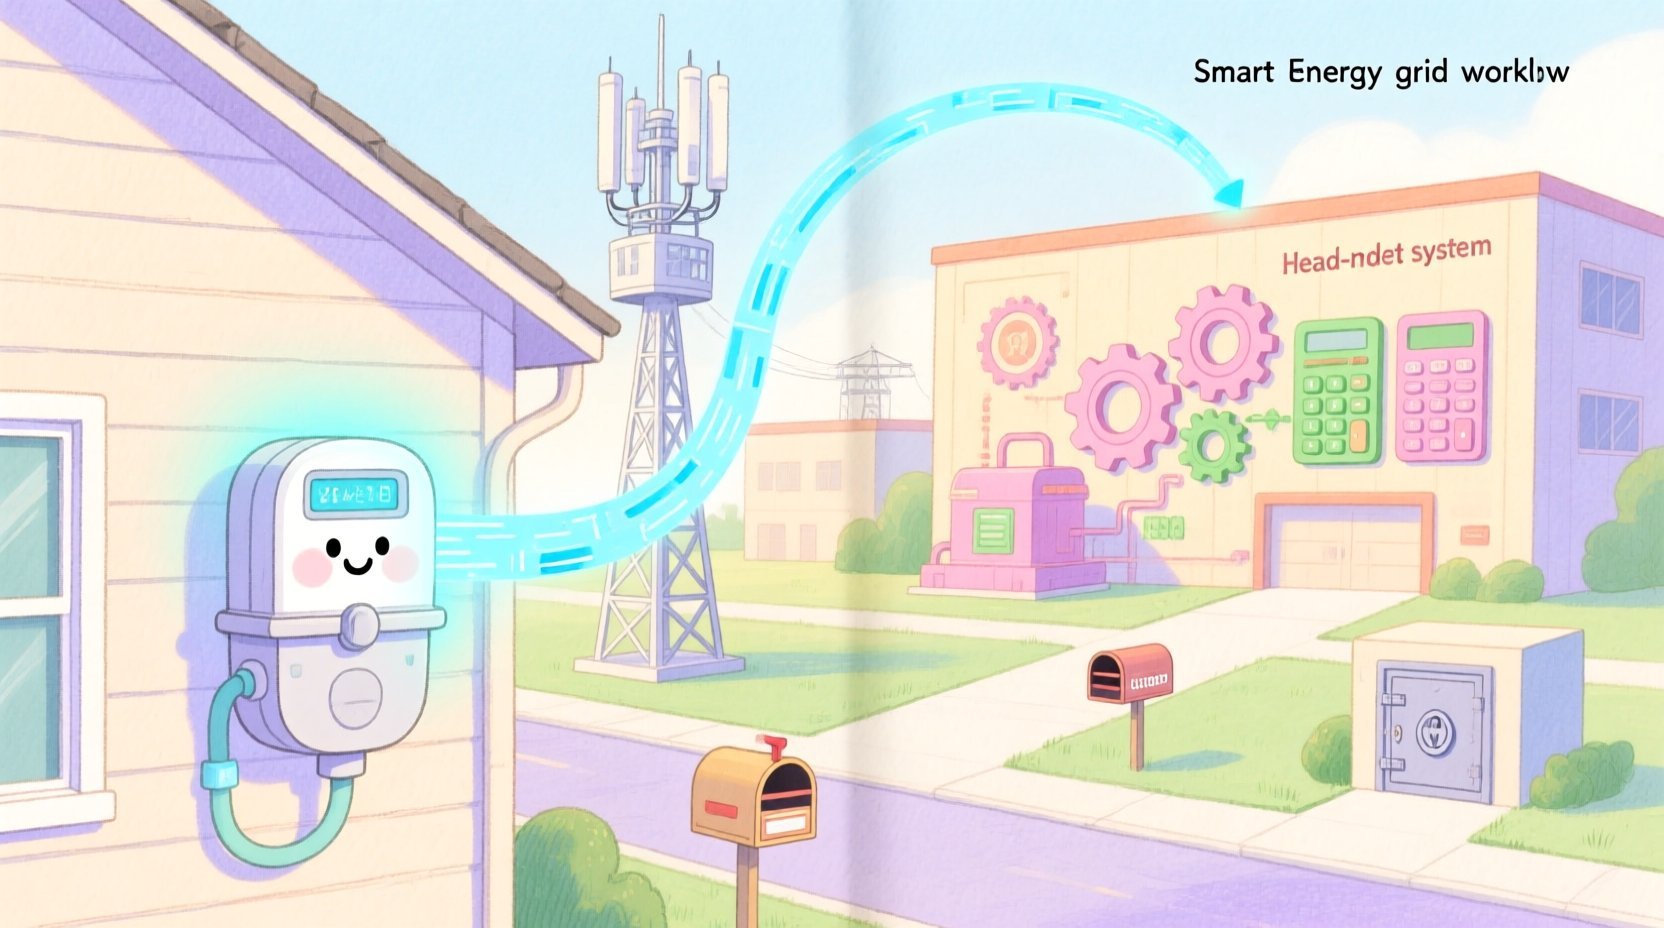
Visual modeling plays a pivotal role in this architecture. An Activity Diagram provides a high-level view of the control flow, illustrating how data moves between different system components over time. By using a diagram-as-code approach with PlantUML inside the VPasCode editor, engineers can maintain living documentation that is version-agnostic, instantly renderable, and easy to update as the system evolves. This tutorial guides you through constructing a professional Billing Data Collection process, leveraging swimlanes to define responsibilities and logic constructs to handle conditional validation and parallel processing.
Understanding the Model: Purpose, Scope & Problem Framing
Before diving into the syntax, it is essential to understand the architectural abstraction we are building. This diagram represents the end-to-end lifecycle of a single billing cycle event within a Smart Grid environment.
Diagram Abstraction & Representation
The Activity Diagram is the chosen visual tool because it excels at modeling sequential workflows and decision logic. Unlike class diagrams which focus on static structure, or sequence diagrams which focus on temporal messaging between objects, an activity diagram focuses on what happens. In this context, it models the transition of raw energy data into a finalized financial record.
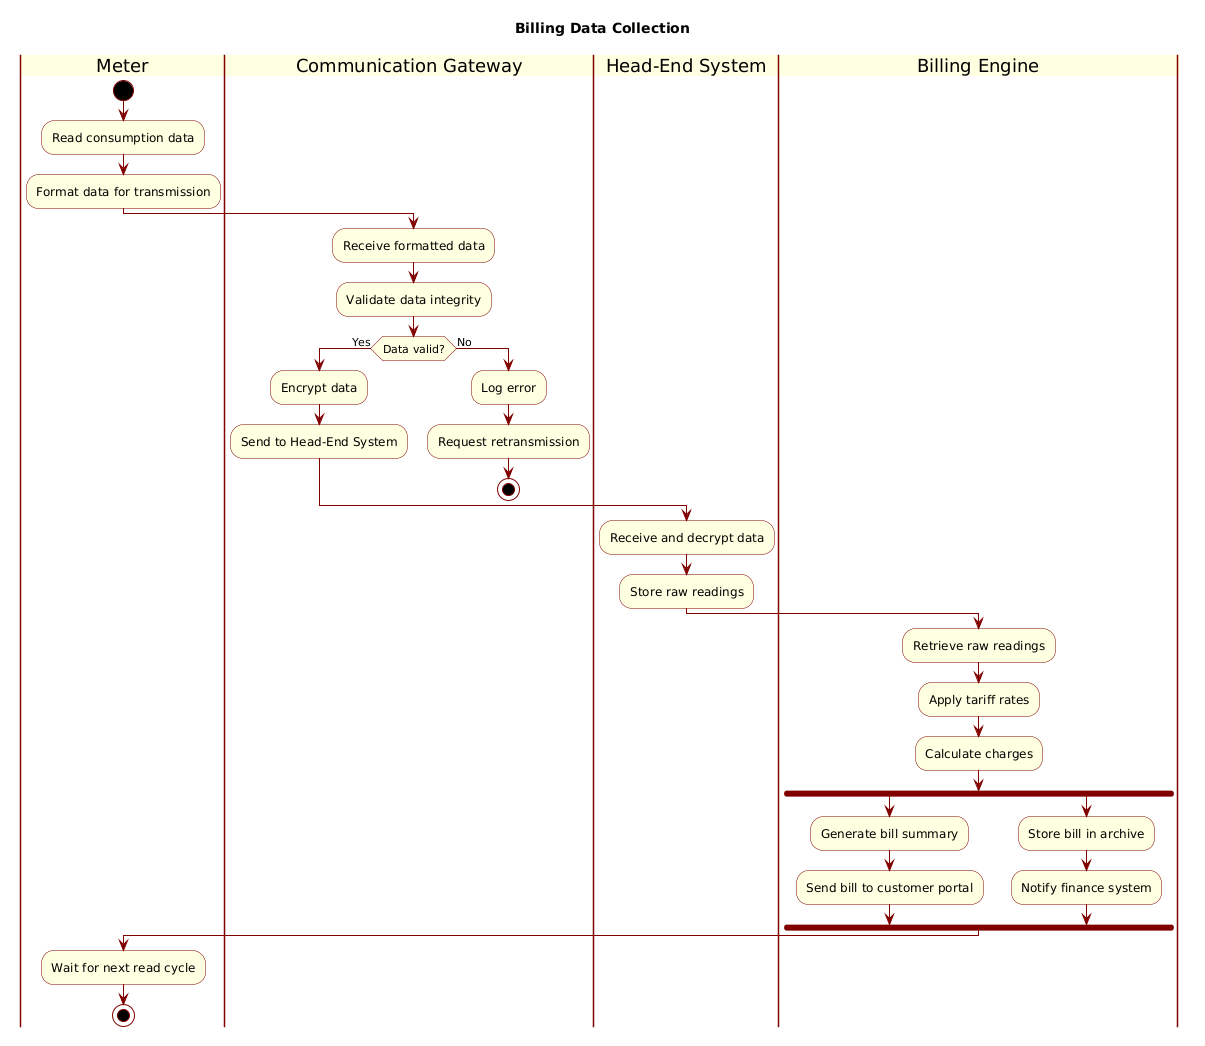
We utilize Swimlanes to partition the workflow by responsibility. Each horizontal lane represents a distinct system component (e.g., the Meter, the Communication Gateway, the Head-End System). This visual separation clarifies boundary conditions and helps identify where data hand-offs occur, which is crucial for debugging latency or security issues in the network.
Target Domain Scope & Scenario
This model specifically covers the Billing Data Collection Process. It intentionally excludes the customer payment phase or the physical installation of the meter, focusing strictly on the data pipeline from the device to the billing engine. The scope includes:
- Data Acquisition: Reading the meter and formatting the payload.
- Transmission Security: Validation, encryption, and error handling.
- Processing: Decryption, storage, and tariff calculation.
- Output: Parallel generation of bills and archival notifications.
Key Takeaways & Educational Insights
By studying this model, you will gain insights into how to handle conditional logic (data validation), manage parallel tasks (bill generation vs. archival), and maintain clear separation of concerns in distributed systems. You will learn how to use VPasCode to prototype these flows instantly without configuring local Java or Graphviz environments.
Complete Diagram & Full Source Code
Below is the complete, finalized blueprint for the Smart Meter Billing Data Collection process. This diagram utilizes the rose theme for professional styling and incorporates swimlanes to define system boundaries.
@startuml
!include https://static.visual-paradigm.com/web/resources/plantuml-stdlib/themes/rose.puml

title Billing Data Collection

|Meter|
start
:Read consumption data;
:Format data for transmission;

|Communication Gateway|
:Receive formatted data;
:Validate data integrity;

if (Data valid?) then (Yes)
  :Encrypt data;
  :Send to Head-End System;
else (No)
  :Log error;
  :Request retransmission;
  stop
endif

|Head-End System|
:Receive and decrypt data;
:Store raw readings;

|Billing Engine|
:Retrieve raw readings;
:Apply tariff rates;
:Calculate charges;

fork
  :Generate bill summary;
  :Send bill to customer portal;
fork again
  :Store bill in archive;
  :Notify finance system;
end fork

|Meter|
:Wait for next read cycle;

stop
@endumlStep-by-Step Architectural Walkthrough
Building this diagram in VPasCode is a structured process. We will break down the construction into four logical phases, moving from layout configuration to complex logic implementation.
Phase 1: Canvas Configuration & Layout Directives
The first step is to set the stage for the diagram. We begin by including the rose theme, which provides a polished, professional look suitable for enterprise documentation. We also define the global title to ensure the diagram is self-explanatory when shared.
!include https://static.visual-paradigm.com/web/resources/plantuml-stdlib/themes/rose.puml

title Billing Data Collection
This ensures that when rendered in the VPasCode browser editor, the diagram immediately conveys its purpose without ambiguity.
Phase 2: Declaring Core Entities, Actors, and Boundaries
Next, we define the swimlanes. In PlantUML, swimlanes are declared using the pipe character | followed by the entity name. This creates vertical sections that group related activities.
|Meter|
start
:Read consumption data;
:Format data for transmission;

|Communication Gateway|
:Receive formatted data;
:Validate data integrity;
Here, the start node marks the entry point of the workflow. The colon : denotes an activity action. Notice how the Meter lane handles the initial data generation, while the Communication Gateway lane handles the immediate hand-off and validation. This visual separation makes it clear that the Meter does not perform validation itself.
Phase 3: Mapping Data Flows & Key Interactions
The core logic of the system lies in the conditional flow and error handling. We use the if statement to model the data integrity check performed by the Gateway.
if (Data valid?) then (Yes)
  :Encrypt data;
  :Send to Head-End System;
else (No)
  :Log error;
  :Request retransmission;
  stop
endif
This structure is critical for energy systems. If data is invalid, the process stops to prevent corrupt data from entering the billing engine. The stop node within the else block signifies a termination of the current flow, ensuring no further processing occurs on bad data.
Phase 4: Grouping, Annotations & Visual Polish
The final phase involves handling parallel processing using the fork keyword. In the Billing Engine, generating the bill and notifying the finance system can happen simultaneously to reduce latency.
fork
  :Generate bill summary;
  :Send bill to customer portal;
fork again
  :Store bill in archive;
  :Notify finance system;
end fork
The fork and fork again blocks allow multiple activities to run concurrently. This is rendered visually as parallel branches that converge at the end fork node, ensuring the workflow waits for both parallel tasks to complete before moving to the final state.
Syntax & Keyword Deep Dive
To master this diagram, you must understand the specific PlantUML syntax features used. Here is a breakdown of the critical keywords:
|Entity|: Defines a swimlane. All activities following this declaration belong to that specific actor until a new swimlane is declared.start/stop: Marks the beginning and end of the workflow. Thestopnode can appear in multiple branches to indicate early termination.if/else/endif: Implements conditional logic. The text in parentheses(Data valid?)represents the decision condition, whilethenandelsedefine the branches.fork/fork again/end fork: Creates parallel execution paths. Use this when multiple tasks can occur independently and simultaneously.:Text;: Denotes an activity or process step. The colon indicates an action, and the semicolon terminates the statement.
Best Practices & Pitfalls to Avoid
When modeling energy system workflows in VPasCode, keep these best practices in mind to ensure your diagrams remain maintainable and clear:
- Maintain Abstraction Levels: Do not mix high-level business logic with low-level implementation details. For example, keep the billing calculation abstract (“Calculate charges”) rather than specifying the specific algorithm used.
- Consistent Naming: Use clear, consistent names for swimlanes (e.g., always use “Head-End System” instead of alternating between “HES” and “Head-End System”).
- Manage Visual Complexity: If a workflow becomes too long, consider breaking it into multiple diagrams (e.g., one for Data Collection, one for Billing Calculation) rather than cramming everything into a single massive activity diagram.
- Validate Logic Paths: Always ensure every
ifstatement has a clear path to astopnode. Deadlocks or infinite loops are common pitfalls in activity modeling.
Start Building PlantUML Activity Diagrams Faster with VPasCode
Immediately test, preview, and customize this Smart Meter Billing diagram online in VPasCode without installing any tools or configuring local environments.