


In the high-stakes environment of financial services, clarity in process modeling is not merely a convenience—it is a regulatory necessity. For a Financial Advisory Portal, the risk assessment process acts as the critical gatekeeper between client acquisition and portfolio management. This workflow dictates how sensitive financial data is ingested, validated, and analyzed to determine a client’s risk tolerance and investment suitability.

Traditional drag-and-drop diagramming tools often struggle with the complexity of branching logic, parallel processing, and strict swimlane separation required for such compliance-heavy workflows. Diagramming-as-code with PlantUML offers a superior alternative. It allows architects and compliance officers to define complex conditional flows, parallel risk assessments, and regulatory checkpoints in a structured, version-safe text format.
Using VPasCode, the free web-based diagram-as-code editor, you can instantly render these complex financial processes without installing local dependencies. This masterclass demonstrates how to construct a professional Activity Diagram that models the end-to-end risk assessment lifecycle, ensuring every stakeholder—from the Client to the Risk Engine and Compliance Officer—has a clear, unambiguous view of the workflow.
Understanding the Model: Purpose, Scope & Problem Framing
Diagram Abstraction & Representation
An Activity Diagram in this context serves as a state-transition map for business logic. Unlike a static class diagram, it captures the dynamic flow of control. We utilize swimlanes to assign responsibility to specific actors (Client, Advisor, Risk Engine, Compliance). This visual separation is critical in finance to delineate where data enters the system, where automated decisions occur, and where human intervention is required.
Target Domain Scope & Scenario
This model specifically covers the Onboarding & Risk Profiling phase of a Financial Advisory Portal. It intentionally excludes backend database persistence details or UI pixel-perfect design, focusing instead on the logical sequence of operations. The scope includes data validation, parallel risk calculation (market risk vs. liquidity), and regulatory compliance checks. It addresses the problem of ensuring no client is onboarded without passing strict suitability and risk tolerance thresholds.
Key Takeaways & Educational Insights
By constructing this diagram, you will gain insights into:
- Responsibility Separation: How swimlanes prevent logical errors by clearly defining who performs which action.
- Parallel Processing: Modeling simultaneous risk checks (e.g., market exposure and liquidity) to optimize assessment time.
- Compliance Loops: Visualizing mandatory re-validation loops that ensure regulatory adherence before proceeding.
Complete Diagram & Full Source Code
Below is the finished blueprint of the Risk Assessment Process. You can view the rendered output directly in the editor. The code utilizes the rose.puml theme for a professional aesthetic suitable for client-facing documentation.
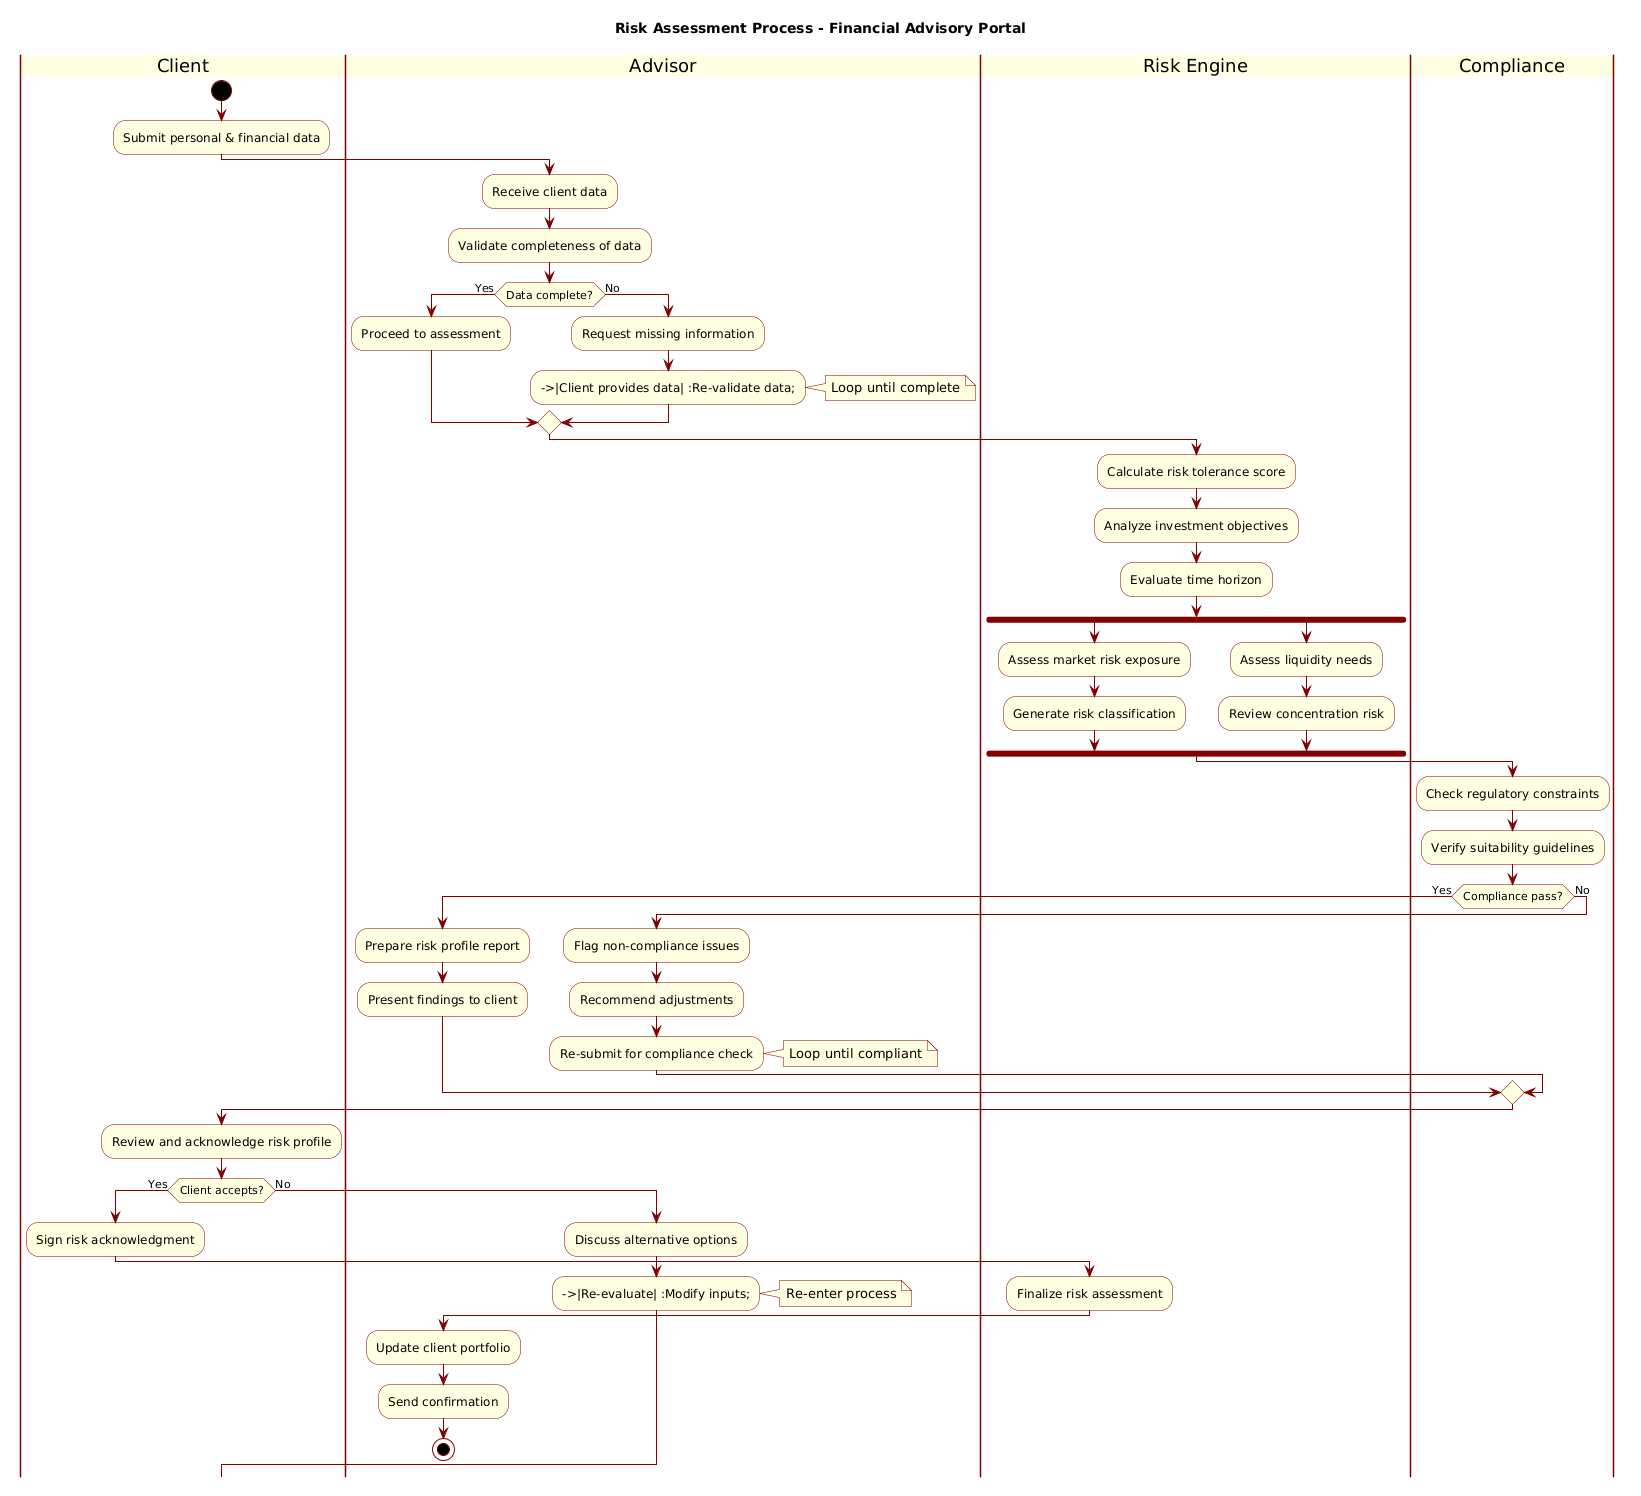
@startuml
!include https://static.visual-paradigm.com/web/resources/plantuml-stdlib/themes/rose.puml

title Risk Assessment Process - Financial Advisory Portal

|Client|
start
:Submit personal & financial data;

|Advisor|
:Receive client data;
:Validate completeness of data;

if (Data complete?) then (Yes)
  :Proceed to assessment;
else (No)
  :Request missing information;
  -->|Client provides data| :Re-validate data;
  note right
    Loop until complete
  end note
endif

|Risk Engine|
:Calculate risk tolerance score;
:Analyze investment objectives;
:Evaluate time horizon;

fork
  :Assess market risk exposure;
  :Generate risk classification;
fork again
  :Assess liquidity needs;
  :Review concentration risk;
end fork

|Compliance|
:Check regulatory constraints;
:Verify suitability guidelines;

if (Compliance pass?) then (Yes)
  |Advisor|
  :Prepare risk profile report;
  :Present findings to client;
else (No)
  |Advisor|
  :Flag non-compliance issues;
  :Recommend adjustments;
  :Re-submit for compliance check;
  note right
    Loop until compliant
  end note
endif

|Client|
:Review and acknowledge risk profile;
if (Client accepts?) then (Yes)
  :Sign risk acknowledgment;
  |Risk Engine|
  :Finalize risk assessment;
  |Advisor|
  :Update client portfolio;
  :Send confirmation;
  stop
else (No)
  |Advisor|
  :Discuss alternative options;
  -->|Re-evaluate| :Modify inputs;
  note right
    Re-enter process
  end note
endif
@endumlStep-by-Step Architectural Walkthrough
Phase 1: Canvas Configuration & Layout Directives
The foundation of any PlantUML diagram lies in its preamble. We begin by including the rose.puml theme to ensure a consistent, professional look that aligns with financial documentation standards. We also define the diagram title to provide immediate context.
@startuml
!include https://static.visual-paradigm.com/web/resources/plantuml-stdlib/themes/rose.puml

title Risk Assessment Process - Financial Advisory Portal
Phase 2: Declaring Core Entities, Actors, and Boundaries
We establish the swimlanes to represent the different actors involved. In VPasCode, swimlanes are declared using the pipe character | followed by the actor name. This creates vertical columns that visually segregate responsibilities.
|Client|
start
:Submit personal & financial data;

|Advisor|
:Receive client data;
:Validate completeness of data;
Here, the start node marks the entry point of the workflow, followed by the initial data submission action. The transition to the Advisor swimlane implies a handoff of responsibility.
Phase 3: Mapping Data Flows & Key Interactions
This phase introduces the core logic: conditional branching and parallel processing. We use if/else blocks to handle validation failures and fork blocks to model simultaneous risk calculations.
if (Data complete?) then (Yes)
  :Proceed to assessment;
else (No)
  :Request missing information;
  -->|Client provides data| :Re-validate data;
  note right
    Loop until complete
  end note
endif

fork
  :Assess market risk exposure;
  :Generate risk classification;
fork again
  :Assess liquidity needs;
  :Review concentration risk;
end fork
The fork directive is crucial here. It allows the Risk Engine to calculate market risk and liquidity needs simultaneously, optimizing the process flow rather than waiting for one to finish before starting the other.
Phase 4: Grouping, Annotations & Visual Polish
The final phase ensures the diagram is complete with compliance checks and termination points. We use note annotations to explain loops (e.g., re-validating data until it is complete) and the stop node to mark the successful conclusion of the process.
if (Compliance pass?) then (Yes)
  |Advisor|
  :Prepare risk profile report;
  :Present findings to client;
else (No)
  |Advisor|
  :Flag non-compliance issues;
  :Recommend adjustments;
  :Re-submit for compliance check;
  note right
    Loop until compliant
  end note
endif

|Client|
:Review and acknowledge risk profile;
if (Client accepts?) then (Yes)
  :Sign risk acknowledgment;
  |Risk Engine|
  :Finalize risk assessment;
  |Advisor|
  :Update client portfolio;
  :Send confirmation;
  stop
Syntax & Keyword Deep Dive
To master PlantUML activity diagrams, understanding the specific syntax keywords is essential. Below is a breakdown of the critical elements used in this financial workflow:
start/stop: Defines the entry and exit points of the activity flow. Every valid activity diagram must have exactly one start and one stop node.|Actor|: Declares a new swimlane. The subsequent actions are automatically placed within this vertical boundary.if (Condition?) then (Result): Creates a decision diamond. Theelseblock handles the negative branch, allowing for complex logic like compliance rejections.fork/fork again/end fork: Initiates parallel threads of execution. This is vital for modeling independent processes that run concurrently, such as assessing different risk factors simultaneously.note right/end note: Adds an annotation box attached to a specific node or flow, used here to clarify looping conditions.-->(Arrow): Represents the flow of control between activities. The|Label|syntax on the arrow allows you to label the transition condition.
Best Practices & Pitfalls to Avoid
When modeling financial workflows in VPasCode, adherence to best practices ensures your diagrams remain maintainable and readable.
- Keep Swimlanes Logical: Ensure each swimlane represents a distinct actor or system component. Avoid mixing automated processes with human roles in the same lane unless they are tightly coupled.
- Label Decision Outcomes: Always label your
if/elsebranches (e.g.,Yes,No). Unlabeled branches make the logic ambiguous, especially for compliance audits. - Limit Parallel Complexity: While
forkis powerful, excessive parallelism can clutter the diagram. Use it only for truly independent tasks, like the risk calculations in this model. - Use Annotations for Loops: Never rely solely on arrows to indicate a loop. Use
noteblocks to explicitly state conditions like “Loop until complete” to prevent misinterpretation.
Start Building PlantUML Activity Diagrams Faster with VPasCode
Visualize complex financial workflows instantly with zero local installation. Test your PlantUML code, preview swimlanes, and export professional diagrams directly in your browser.