


Introduction: Visualizing IoT Manufacturing Workflows
In the rapidly evolving landscape of Industry 4.0, the Internet of Things (IoT) has become the backbone of modern manufacturing. Factory floors are no longer silent; they are buzzing with data from thousands of sensors monitoring temperature, pressure, vibration, and throughput. However, raw data is useless without a clear understanding of how it flows through the system. For software architects and system engineers, visualizing these interactions is critical to ensure reliability, latency management, and data integrity.
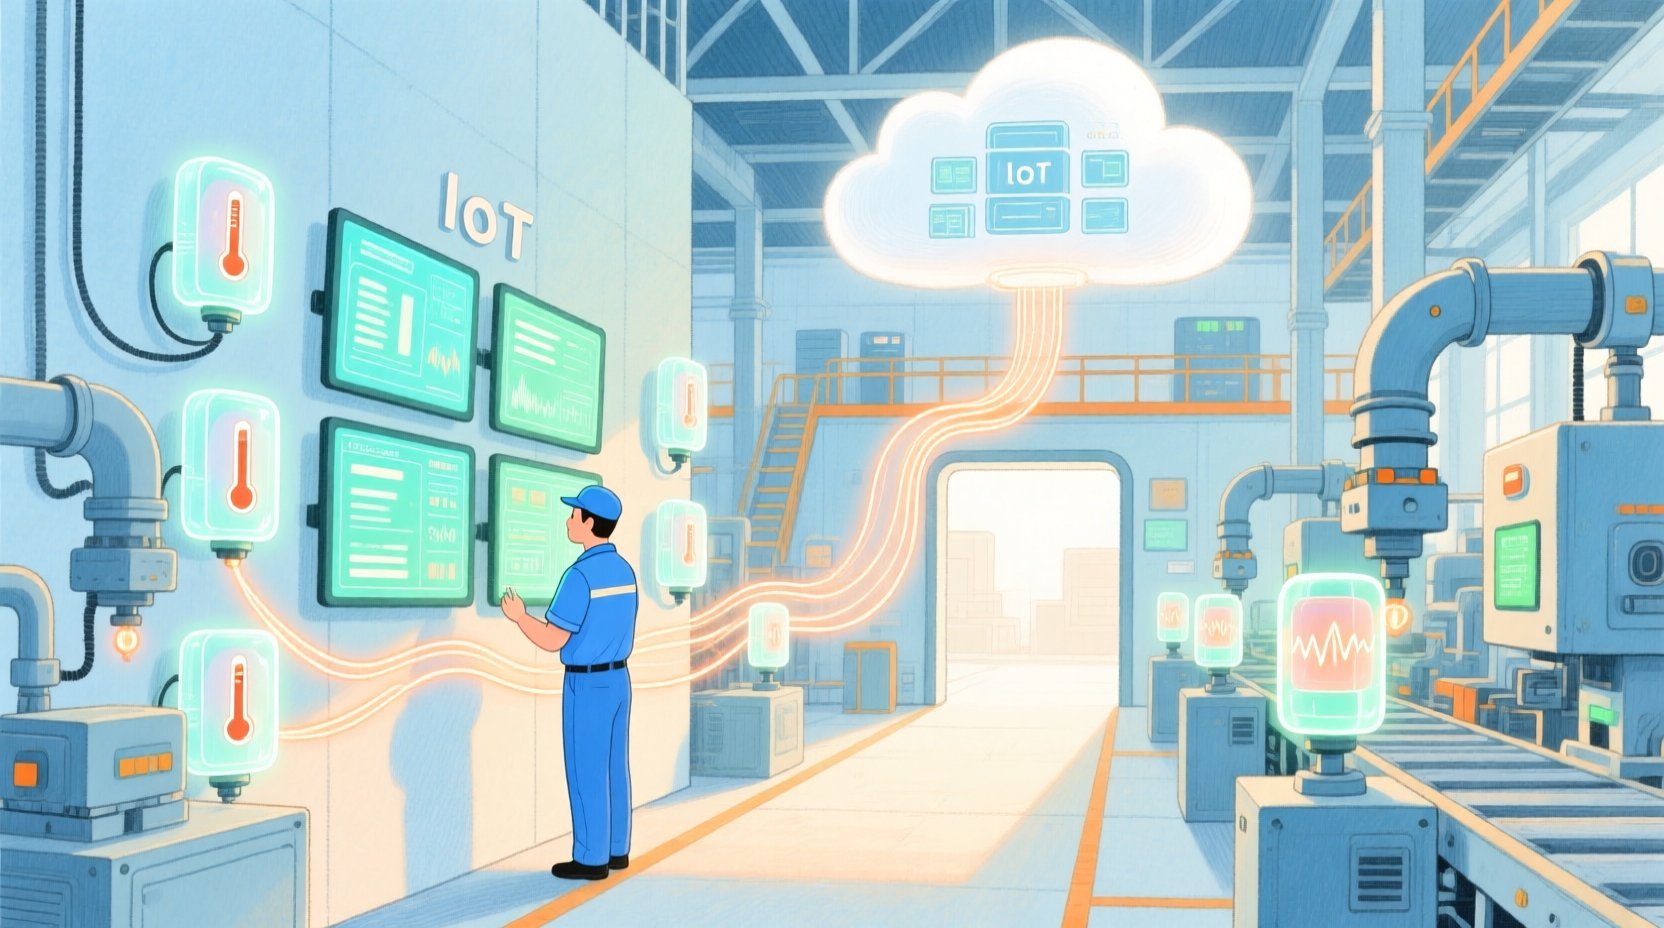
This tutorial serves as a masterclass in designing a Sensor Data Aggregation Sequence Diagram using PlantUML. We will leverage VPasCode, the free web-based diagram-as-code editor, to prototype, render, and refine this architecture without any local setup. By adopting a diagram-as-code approach, teams can maintain living documentation that evolves alongside their codebase, ensuring that visual representations of complex IoT workflows remain accurate and accessible.
Using VPasCode, you can write PlantUML code directly in your browser and see the diagram render instantly. This eliminates the friction of environment configuration, allowing you to focus on architectural logic rather than tool setup.
Understanding the Model: Purpose, Scope & Problem Framing
Diagram Abstraction & Representation
A Sequence Diagram is the ideal tool for modeling time-ordered interactions between system components. In the context of an IoT factory floor, the primary concern is the temporal flow of data: when a sensor triggers, how does the gateway process it, and when does the cloud acknowledge receipt? This diagram abstraction captures the lifelines of active participants (sensors, gateways, cloud) and the messages exchanged between them.
Unlike static architecture diagrams, sequence diagrams reveal the dynamic behavior of the system. They highlight critical paths, such as data validation, aggregation logic, and error handling (e.g., network unavailability). For manufacturing environments, understanding these flows is vital for diagnosing latency issues or data loss in real-time operations.
Target Domain Scope & Scenario
This tutorial focuses on a specific sub-system: Sensor Data Aggregation. The scope is bounded by the physical sensor layer and the cloud backend. It intentionally excludes lower-level hardware protocols (like Modbus or OPC UA) to focus on the logical data exchange. The scenario covers:
- Activation: The operator initiating data collection.
- Cyclic Processing: Sensors sending data every 5 seconds.
- Edge Logic: The gateway validating and aggregating data before sending it upstream.
- Cloud Integration: Storage and dashboarding of time-series data.
- Exception Handling: Alternative flows for invalid data or offline modes.
Key Takeaways & Educational Insights
By completing this tutorial, you will gain:
- Architectural Clarity: A visual map of how edge computing reduces cloud load.
- Error Handling Patterns: How to model
altandloopfragments for robust systems. - VPasCode Proficiency: Mastery of the web-based editor for rapid diagram iteration.
Complete Diagram & Full Source Code
Below is the finalized PlantUML source code for the Sensor Data Aggregation scenario. This blueprint incorporates the aws-orange theme, actor definitions, and complex interaction flows including loops and conditional logic.
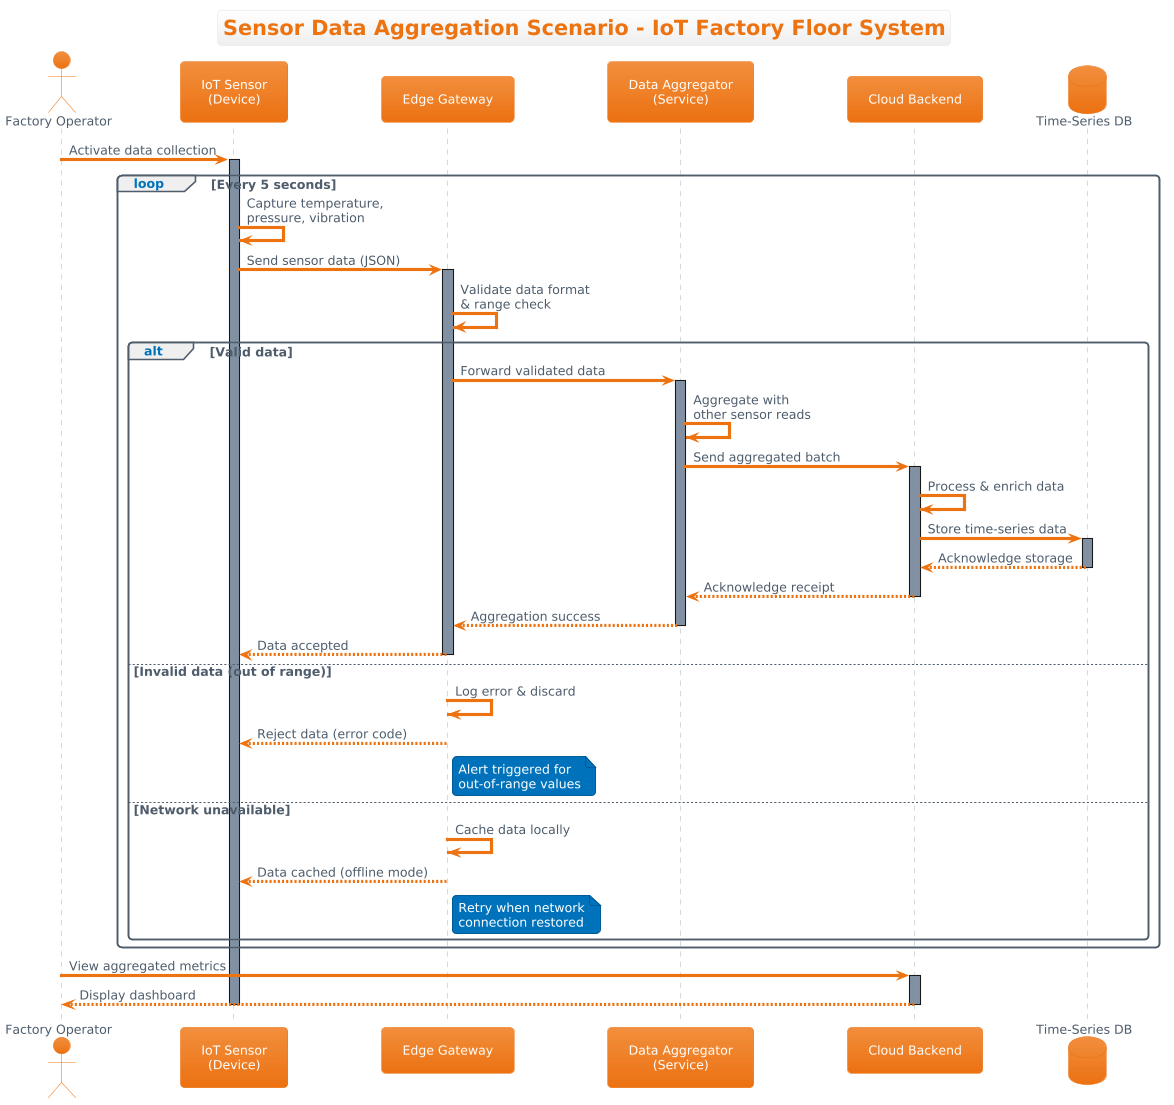
@startuml
!theme aws-orange
title Sensor Data Aggregation Scenario - IoT Factory Floor System

/'
This sequence diagram illustrates the sensor data aggregation process
in an IoT-enabled factory floor system. It shows how multiple sensors
send data to a gateway, which aggregates and forwards the data to the
cloud for processing and storage. Alternative flows handle cases where
sensor data is invalid or the network is unavailable.
'/

actor "Factory Operator" as Operator
participant "IoT Sensor\n(Device)" as Sensor
participant "Edge Gateway" as Gateway
participant "Data Aggregator\n(Service)" as Aggregator
participant "Cloud Backend" as Cloud
database "Time-Series DB" as Database

Operator -> Sensor: Activate data collection
activate Sensor

loop Every 5 seconds
    Sensor -> Sensor: Capture temperature,\npressure, vibration
    Sensor -> Gateway: Send sensor data (JSON)
    activate Gateway

    Gateway -> Gateway: Validate data format\n& range check

    alt Valid data
        Gateway -> Aggregator: Forward validated data
        activate Aggregator

        Aggregator -> Aggregator: Aggregate with\nother sensor reads
        Aggregator -> Cloud: Send aggregated batch
        activate Cloud

        Cloud -> Cloud: Process & enrich data
        Cloud -> Database: Store time-series data
        activate Database
        Database --> Cloud: Acknowledge storage
        deactivate Database

        Cloud --> Aggregator: Acknowledge receipt
        deactivate Cloud
        Aggregator --> Gateway: Aggregation success
        deactivate Aggregator
        Gateway --> Sensor: Data accepted
        deactivate Gateway

    else Invalid data (out of range)
        Gateway -> Gateway: Log error & discard
        Gateway --> Sensor: Reject data (error code)
        deactivate Gateway
        note right of Gateway
            Alert triggered for
            out-of-range values
        end note

    else Network unavailable
        Gateway -> Gateway: Cache data locally
        Gateway --> Sensor: Data cached (offline mode)
        deactivate Gateway
        note right of Gateway
            Retry when network
            connection restored
        end note
    end
end

Operator -> Cloud: View aggregated metrics
activate Cloud
Cloud --> Operator: Display dashboard
deactivate Cloud
deactivate Sensor
@endumlStep-by-Step Architectural Walkthrough
Constructing a professional sequence diagram requires a structured approach. We will break down the code construction into four distinct phases, demonstrating how to build the diagram incrementally within VPasCode.
Phase 1: Canvas Configuration & Layout Directives
Before defining actors, you must set the visual context. In PlantUML, this is done using directives at the top of the file. We begin by selecting a theme to ensure the diagram matches your organizational branding.
In the code above, we use !theme aws-orange. This applies a specific color palette suitable for cloud-centric architectures. Next, we define the diagram title to provide immediate context for stakeholders.
!theme aws-orange
title Sensor Data Aggregation Scenario - IoT Factory Floor System
Following the title, we add a comment block using /' and '/. This is crucial for documentation, as these comments appear in the rendered diagram as a description box, explaining the scope to anyone viewing the diagram without needing the source code.
/'
This sequence diagram illustrates the sensor data aggregation process
in an IoT-enabled factory floor system...
'/
Phase 2: Declaring Core Entities, Actors, and Boundaries
The foundation of a sequence diagram is the participants. These represent the system components involved in the interaction. In PlantUML, we use specific keywords to define the type of participant.
actor: Represents a human user or external system (e.g.,Operator).participant: Represents a software component or service (e.g.,Gateway,Cloud).database: Represents data storage (e.g.,Time-Series DB).
We assign aliases (e.g., as Operator) to make subsequent message references concise. Note the use of \n to create line breaks within labels, which is essential for fitting long names like "IoT Sensor\n(Device)" into the diagram layout.
actor "Factory Operator" as Operator
participant "Edge Gateway" as Gateway
database "Time-Series DB" as Database
Phase 3: Mapping Data Flows & Key Interactions
Once participants are declared, we define the flow of messages. In manufacturing IoT, data is often cyclic. We use the loop keyword to represent the recurring nature of sensor reading every 5 seconds.
Inside the loop, we define the interaction between the Sensor and the Gateway. The arrow style indicates the message type: -> for synchronous messages and --> for return messages.
loop Every 5 seconds
    Sensor -> Gateway: Send sensor data (JSON)
    activate Gateway
    ...
    Gateway --> Sensor: Data accepted
    deactivate Gateway
end
The activate and deactivate keywords are critical. They render the rectangular “activation bar” on the lifeline, visually indicating when a participant is busy processing. This helps identify bottlenecks where a component holds up the flow.
Phase 4: Grouping, Annotations & Visual Polish
Real-world systems must handle exceptions. We use the alt keyword to define alternative flows based on conditions (e.g., Valid data vs. Invalid data). This allows the diagram to show the system’s resilience.
We also use note to add contextual information. For instance, if the network is unavailable, we note that the gateway will cache data locally. This annotation provides immediate insight into the offline capability of the edge device.
alt Network unavailable
    Gateway -> Gateway: Cache data locally
    note right of Gateway
        Retry when network
        connection restored
    end note
end
Syntax & Keyword Deep Dive
To master PlantUML in VPasCode, understanding the specific syntax is essential. Here is a breakdown of the keywords used in this diagram:
actor: Defines a human user or external entity interacting with the system.participant: Defines a generic system component or service.database: Specifically identifies a data store component.->(Arrow): Represents a synchronous message or method call.-->(Dashed Arrow): Represents a return message or response.loop: Encapsulates a block of messages that repeat for a specific duration or count.alt: Defines a conditional block (if/else) where only one path is executed.note: Adds a text annotation attached to a specific lifeline or message.activate/deactivate: Manually controls the visibility of the activation bar on a lifeline.
Best Practices & Pitfalls to Avoid
When creating sequence diagrams for complex manufacturing systems, adherence to best practices ensures clarity and maintainability.
- Maintain Consistent Abstraction: Do not mix high-level business flows with low-level protocol details (like MQTT topics) unless necessary. Keep the diagram focused on the logical data flow.
- Use Descriptive Aliases: Always define aliases (e.g.,
as Gateway) to keep message lines readable. Avoid repeating long component names. - Limit Lifeline Complexity: If a participant has too many interactions, consider splitting the diagram into multiple smaller diagrams (e.g., one for Data Ingestion, one for Dashboarding).
- Leverage VPasCode for Iteration: Use the live preview to test changes instantly. If a diagram becomes too crowded, adjust the theme or layout directives rather than manually tweaking spacing.
Try It Yourself with VPasCode
Start Building PlantUML Sequence Diagrams Faster with VPasCode
Test, preview, and customize this IoT manufacturing diagram online in VPasCode without installing any tools or configuring environments.