


In the high-stakes world of finance, clarity is currency. Before a single line of code is written for a Risk Assessment System, architects and product owners must agree on what the system does, not just how it does it. This is where visual modeling becomes critical. A Use Case Diagram serves as the bridge between business requirements and technical implementation, mapping out the functional goals of the system and the roles (actors) that interact with it.
For financial institutions, defining boundaries is non-negotiable. You need to know exactly who can identify risks, who evaluates impact, and how external data sources integrate into the workflow. Writing this model as code using PlantUML within VPasCode offers a distinct advantage over traditional drawing tools: it treats your architecture documentation as a living artifact. You can instantly visualize requirements, iterate on actor relationships, and generate professional documentation without the friction of manual drag-and-drop design.
Understanding the Model: Purpose, Scope & Problem Framing
Before diving into the syntax, it is essential to understand the modeling abstraction. A Use Case Diagram is not a flowchart; it is a functional map.
Diagram Abstraction & Representation
In this context, the diagram models the functional scope of the Risk Assessment System. It answers three fundamental questions:
- Who? (Actors): The human or external entities initiating actions (e.g., Risk Manager, Project Lead).
- What? (Use Cases): The specific high-level goals or functions the system provides (e.g., Identify Risks, Generate Report).
- How? (Relationships): The interactions that connect actors to the system’s capabilities.
Target Domain Scope & Scenario
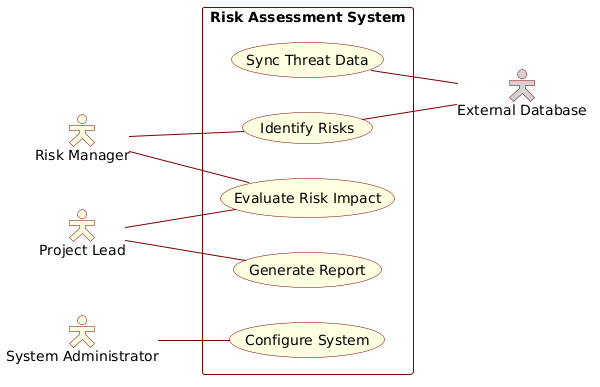
This specific model focuses on the Enterprise Risk Management domain. The system boundaries are intentionally scoped to the core assessment workflow. We are modeling a scenario where a Risk Manager initiates assessments, a Project Lead reviews outcomes, and a System Administrator maintains data integrity. The inclusion of an External Database actor highlights the system’s dependency on external threat intelligence, a common requirement in modern fintech architectures.
Key Takeaways & Educational Insights
By constructing this diagram, you will gain clarity on:
- Separating user roles from system functions.
- Defining clear system boundaries using rectangles.
- Visualizing data dependencies (External Database) as actors.
- Using PlantUML syntax to enforce consistency in your architectural documentation.
Complete Diagram & Full Source Code
Below is the finished blueprint for the Risk Assessment System. You can view the rendered diagram and interact with the code directly in the VPasCode editor.
Copy the following complete source code to start your own project in the VPasCode web editor:
@startuml
!include https://static.visual-paradigm.com/web/resources/plantuml-stdlib/themes/rose.puml

left to right direction
skinparam actorStyle hollow

actor "Risk Manager" as RM
actor "Project Lead" as PL
actor "System Administrator" as SA
actor "External Database" as DB #lightgray

rectangle "Risk Assessment System" {
    usecase "Identify Risks" as UC1
    usecase "Evaluate Risk Impact" as UC2
    usecase "Generate Report" as UC3
    usecase "Configure System" as UC4
    usecase "Sync Threat Data" as UC5
}

RM -- UC1
RM -- UC2
PL -- UC2
PL -- UC3
SA -- UC4

UC1 -- DB
UC5 -- DB
@endioStep-by-Step Architectural Walkthrough
Building a professional diagram is a layered process. We will construct this model in four distinct phases: setting the theme, defining actors, creating the system boundary, and mapping interactions.
Phase 1: Canvas Configuration & Layout Directives
Every diagram starts with its environment. In PlantUML, we begin by declaring the start of the diagram and applying a visual theme to ensure professional aesthetics immediately.
@startuml: Marks the beginning of the diagram definition.!include ...: Imports the “rose” theme from the PlantUML standard library. This gives the diagram a polished, colored look without manual styling.left to right direction: Sets the layout flow. For Use Case diagrams, horizontal flow often reads better on wide screens.
@startuml
!include https://static.visual-paradigm.com/web/resources/plantuml-stdlib/themes/rose.puml

left to right direction
skinparam actorStyle hollow
Phase 2: Declaring Core Entities, Actors, and Boundaries
Next, we define the participants. In Use Case modeling, actors represent roles. We assign unique IDs (like RM, PL) to make referencing them easier later.
actor "Name" as ID: Defines a human actor.actor "Name" as ID #color: Defines an external system or database actor with a distinct color.rectangle "System Name" { ... }: Creates the system boundary. Everything inside this box is a function provided by the system.
actor "Risk Manager" as RM
actor "Project Lead" as PL
actor "System Administrator" as SA
actor "External Database" as DB #lightgray

rectangle "Risk Assessment System" {
    usecase "Identify Risks" as UC1
    usecase "Evaluate Risk Impact" as UC2
    usecase "Generate Report" as UC3
    usecase "Configure System" as UC4
    usecase "Sync Threat Data" as UC5
}
Phase 3: Mapping Data Flows & Key Interactions
Now we connect the actors to the use cases. The solid line (--) represents an association, meaning the actor can perform that specific function.
RM -- UC1: The Risk Manager is responsible for identifying risks.PL -- UC3: The Project Lead receives the generated report.UC1 -- DB: The “Identify Risks” function pulls data from the External Database.
RM -- UC1
RM -- UC2
PL -- UC2
PL -- UC3
SA -- UC4

UC1 -- DB
UC5 -- DB
Phase 4: Grouping, Annotations & Visual Polish
Finally, we close the diagram definition. In this specific model, we used a skinparam directive to make actors appear hollow (outline style), which helps them stand out against the background and use case ovals. The diagram ends with @enduml.
Syntax & Keyword Deep Dive
To master VPasCode and PlantUML, you must understand the core keywords that drive the rendering engine.
actor: Defines a participant (human or system) that interacts with the system. It renders as a stick figure or a box depending on the theme.usecase: Defines a functional goal or service provided by the system. It renders as an oval shape.rectangle: Creates a boundary box. In Use Case diagrams, this represents the system under design. Anything inside is a use case; anything outside is an actor.--: The Association operator. It draws a solid line between two entities, indicating a direct interaction.skinparam: A powerful directive for visual customization. In this example,skinparam actorStyle hollowchanges the actor rendering style to an outline rather than a filled figure.!include: Allows you to import external resources, such as themes or shared definitions, keeping your code modular.
Best Practices & Pitfalls to Avoid
When modeling financial systems or complex architectures, avoid these common pitfalls to maintain diagram clarity.
- Don’t Mix Levels of Abstraction: Ensure your use cases represent goals (e.g., “Generate Report”), not implementation details (e.g., “Click Button A”). If a use case becomes too complex, break it down into a separate diagram.
- Use Meaningful IDs: When using
as RMoras UC1, choose abbreviations that are readable. Avoid random numbers likeas A1unless the diagram is extremely large. - Group Related Functions: Always enclose your use cases in a
rectangleboundary. Without this, the diagram lacks a clear system context, making it hard to distinguish between internal logic and external actors. - Limit Actor Complexity: If you have too many actors, consider grouping them into roles or using inheritance (though not shown here) to simplify the visual noise.
Try It Yourself with VPasCode
Start Building Use Case Diagrams Faster with VPasCode
Instantly prototype your Risk Assessment System architecture online with VPasCode, the free PlantUML editor. No installation required—just write code and see your diagram render live.