


In the high-stakes environment of financial technology, clarity is currency. High-Frequency Trading (HFT) platforms operate on the edge of nanoseconds, requiring architectures that are not only robust but also meticulously documented. For software architects and engineers, visualizing the internal structure of these systems is critical to ensuring data integrity, low latency, and fail-safe risk management.

A common challenge in HFT development is mapping the complex interplay between market data ingestion, strategy execution, and order routing. Traditional diagramming tools often lack the agility to iterate quickly or the precision to define strict interface contracts. This is where diagram-as-code becomes a strategic advantage. By using PlantUML within the VPasCode editor, teams can define system boundaries, interface contracts, and component relationships in text before rendering them instantly in the browser.
This masterclass demonstrates how to build a professional Component Diagram for a High-Frequency Trading Platform. We will leverage VPasCode to render a live preview, ensuring that your architectural documentation remains synchronized with your codebase. The result is a clear, scalable blueprint that highlights the separation of concerns essential for modern financial systems.
Understanding the Model: Purpose, Scope & Problem Framing
Before diving into the syntax, it is essential to understand the architectural abstraction we are modeling. A component diagram focuses on the system’s structural organization, hiding implementation details in favor of exposing interfaces and connections.
Diagram Abstraction & Representation
This diagram models the High-Frequency Trading Platform as a collection of interacting software components. Unlike a sequence diagram that focuses on temporal message flows, this component diagram emphasizes structural dependencies and interface contracts. We utilize the ball-and-socket notation to distinguish between Provided Interfaces (sockets) and Required Interfaces (balls). This visual convention immediately communicates which component offers a service and which one consumes it, a crucial distinction in a multi-threaded, low-latency trading environment.
Target Domain Scope & Scenario
The scope of this model covers the core trading lifecycle:
- Connectivity Layer: Handles external data feeds (Market Data Gateway) and exchange connections (Order Gateway).
- Trading Core: The brain of the operation, including the Strategy Engine (signal generation) and Order Router (execution logic).
- Risk Management: A critical safety net that validates orders before they hit the market.
- Management: Administrative oversight for order state and lifecycle.
This architecture isolates the Strategy Engine from the specific exchanges it trades on, allowing for modularity and easier integration of new market venues.
Key Takeaways & Educational Insights
By completing this tutorial, you will gain:
- Understanding of how to group components into logical packages (e.g., Connectivity vs. Core).
- Proficiency in defining Provided vs. Required interfaces using PlantUML syntax.
- Insight into organizing financial system diagrams for maximum readability and maintenance.
Complete Diagram & Full Source Code
Below is the final blueprint for the High-Frequency Trading Platform. You can visualize the rendered output immediately in the VPasCode editor.
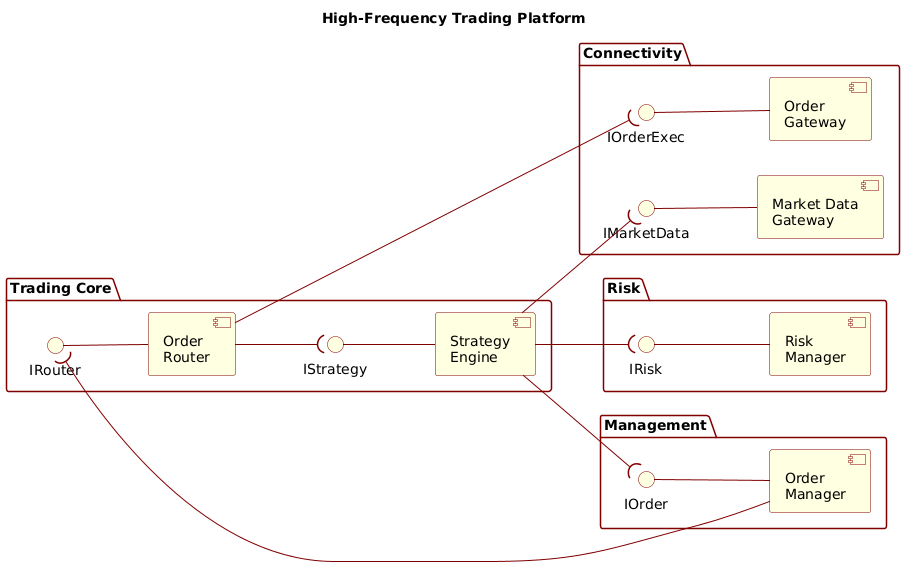
Copy the following source code to replicate this diagram in VPasCode:
@startuml
!include https://static.visual-paradigm.com/web/resources/plantuml-stdlib/themes/rose.puml

left to right direction

title High-Frequency Trading Platform

/'
This diagram shows the main components of an HFT platform and how they interact.
Market data flows in, trading strategies generate signals, risk checks are performed,
and orders are routed to exchanges.
'/

package "Connectivity" {
    component "Market Data\nGateway" as MDG
    interface IMarketData as IMD
    IMD -- MDG

    component "Order\nGateway" as OG
    interface IOrderExec as IOE
    IOE -- OG
}

package "Trading Core" {
    component "Strategy\nEngine" as SE
    interface IStrategy as IS
    IS -- SE

    component "Order\nRouter" as OR
    interface IRouter as IR
    IR -- OR
}

package "Risk" {
    component "Risk\nManager" as RM
    interface IRisk as IRK
    IRK -- RM
}

package "Management" {
    component "Order\nManager" as OM
    interface IOrder as IO
    IO -- OM
}

' Required interfaces (socket on the right)
SE --( IMD
SE --( IRK
SE --( IO

OR --( IS
OR --( IOE

OM --( IR

@endumlStep-by-Step Architectural Walkthrough
Building this diagram in VPasCode is an iterative process. We will break down the construction into four logical phases, moving from canvas setup to final interface connections.
Phase 1: Canvas Configuration & Layout Directives
Every PlantUML diagram begins with setup. We define the rendering engine and the visual theme. For this financial architecture, we want a clean, professional look.
First, we include the VPasCode theme library. This ensures consistent styling across your documentation:
!include https://static.visual-paradigm.com/web/resources/plantuml-stdlib/themes/rose.pumlNext, we set the direction of the diagram. In financial data flows, information often moves horizontally from ingestion to execution. We enforce this with:
left to right directionThis directive ensures the layout flows logically from the data sources on the left to the management systems on the right.
Phase 2: Declaring Core Entities, Actors, and Boundaries
The core of the diagram is the package directive. This groups related components, creating a visual boundary that reflects architectural layers. We define four distinct packages:
package "Connectivity" {
    // ... components here
}

package "Trading Core" {
    // ... components here
}
Inside each package, we declare the component shapes. In an HFT system, components represent microservices or critical modules. We use the as keyword to assign an alias (e.g., as MDG) for easier reference in interface connections later.
component "Market Data\nGateway" as MDGNote the use of \n to create line breaks within component labels, keeping the diagram tidy when names are long.
Phase 3: Mapping Data Flows & Key Interactions
The most critical part of a component diagram is defining how components interact. We use the interface keyword to define the contract.
Provided Interfaces: These are services a component offers to others. Visually, this is represented by a lollipop (circle) on the component.
interface IMarketData as IMD
IMD -- MDG
Here, the MDG component provides the IMD interface. The arrow points from the interface to the component.
Required Interfaces: These are services a component needs. Visually, this is a socket (curly brace) on the component.
SE --( IMDThe --( syntax indicates a Required Interface. The Strategy Engine (SE) requires the IMD interface. The socket is placed on the SE side, and the ball on the IMD side, visually locking them together.
Phase 4: Grouping, Annotations & Visual Polish
To make the diagram self-documenting, we add a title and a comment block. This provides context for anyone reading the diagram without needing external documentation.
title High-Frequency Trading Platform

/'
This diagram shows the main components of an HFT platform...
'/
The comment block starts with /' and ends with '/. This text appears in the diagram rendering but does not affect the structure. This is essential for maintaining architectural context in VPasCode.
Syntax & Keyword Deep Dive
To master this diagram, you must understand the specific PlantUML keywords used to model component relationships.
@startuml/@enduml: The mandatory delimiters that wrap the entire diagram definition.package: Groups components into logical subsystems (e.g., “Risk”, “Connectivity”).component: Defines a software component. It can be connected to interfaces or other components.interface: Defines a contract or service. It is used to decouple components.--: Represents a relationship or realization. In component diagrams, it often links an interface to its implementing component.--(: The specific syntax for a Required Interface. The curly brace(indicates the socket is on the left component (the consumer).\n: An escape sequence used to insert a newline character within a label string./' ... '/: A comment block that renders as text within the diagram for context.
Best Practices & Pitfalls to Avoid
When modeling financial architectures, precision is paramount. Follow these best practices to ensure your diagrams remain maintainable.
- Modularize with Packages: Do not dump all components on the canvas. Use
packageblocks to separate concerns (e.g., keep Risk logic separate from Trading Logic). This reduces visual clutter and aligns with microservice architecture principles. - Consistent Interface Naming: Use clear prefixes for interfaces (e.g.,
IOrder,IRisk). This makes the diagram readable even when zoomed out. - Separate Provided from Required: Clearly distinguish between what a component does (Provided) and what it needs (Required). The
--vs--(syntax is vital for this distinction. - Keep Labels Concise: Use
\nto wrap long names. Avoid overly verbose component names that break the layout flow.
Try It Yourself with VPasCode
Start Building High-Frequency Trading Diagrams Faster with VPasCode
Instantly render complex PlantUML component diagrams in your browser with zero setup, and share your architectural blueprints with your team today.