


In the complex world of international logistics, visibility is the currency of trust. Supply chains span continents, crossing regulatory borders, multiple carriers, and diverse data formats. For software architects designing systems to manage this chaos, a static document is often insufficient; the architecture must be as dynamic as the freight it tracks. A well-structured component diagram provides the necessary blueprint, defining the boundaries between shipment monitoring, customs compliance, and stakeholder notifications without getting lost in implementation details.
Diagramming as code, specifically using PlantUML within VPasCode, transforms this architectural challenge into a manageable, version-ready process. Instead of wrestling with drawing tools, engineers write declarative code that renders instantly. This approach ensures that the system architecture remains synchronized with the actual codebase, reducing the risk of documentation drift. By leveraging VPasCode’s free web editor, teams can prototype these complex logistics architectures instantly, testing interface contracts and data flows before a single line of backend code is committed.

Understanding the Model: Purpose, Scope & Problem Framing
This tutorial focuses on constructing a Component Diagram for an International Supply Chain Tracking System. In the realm of software architecture, a component diagram is not merely a picture; it is a contract. It defines the structural organization of a system by showing its components, their provided interfaces, and their required interfaces. For the logistics industry, this abstraction is critical because it separates the what (the service capabilities) from the how (the underlying implementation logic).
The scope of this model covers the high-level integration of three distinct architectural layers: the Tracking Core, the Integration Layer, and Stakeholder Services. The Tracking Core handles the state of the shipment itself. The Integration Layer manages external dependencies like carrier feeds and customs regulations. The Stakeholder Services layer ensures that the right information reaches the right people via dashboards and alerts. By grouping these components into packages, we create a clear mental model of where data originates and where it is consumed.
By mastering this diagram, you will gain insights into how to manage dependency inversion in complex systems. You will learn how to define strict boundaries using interfaces, ensuring that the Shipment Tracker does not need to know the specific details of the Carrier Gateway, only that it can request data. This modularity is essential for scalable logistics platforms that must adapt to new carriers or regulatory bodies without refactoring the entire tracking engine.
Complete Diagram & Full Source Code
Before diving into the step-by-step construction, it is essential to visualize the end goal. The following diagram represents the full architectural blueprint of the International Supply Chain Tracking System. It utilizes the cerulean theme for professional readability and organizes components into logical packages.
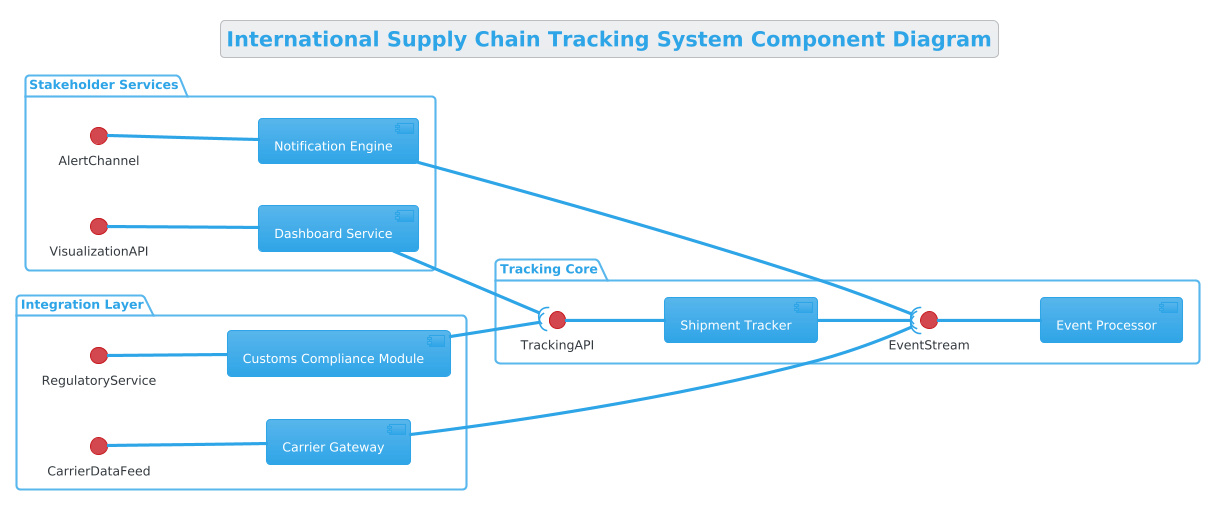
Below is the complete PlantUML source code required to generate this diagram. You can copy this entire block into the VPasCode editor to see it render instantly.
@startuml
!theme cerulean
left to right direction
title International Supply Chain Tracking System Component Diagram
/'
This diagram illustrates the architectural components of an International Supply Chain Tracking System designed to provide end-to-end visibility across global logistics networks. The system integrates shipment monitoring, customs compliance, carrier data aggregation, and stakeholder notifications to address challenges in cross-border tracking, regulatory adherence, and real-time status transparency for international freight movements.
'/

package "Tracking Core" {
    component [Shipment Tracker] as ShipmentTracker
    component [Event Processor] as EventProcessor
    interface "TrackingAPI" as TrackingAPI
    interface "EventStream" as EventStream

    TrackingAPI -- ShipmentTracker
    ShipmentTracker --( EventStream
    EventStream -- EventProcessor
}

package "Integration Layer" {
    component [Carrier Gateway] as CarrierGateway
    component [Customs Compliance Module] as CustomsModule
    interface "CarrierDataFeed" as CarrierDataFeed
    interface "RegulatoryService" as RegulatoryService

    CarrierDataFeed -- CarrierGateway
    CarrierGateway --( EventStream
    RegulatoryService -- CustomsModule
    CustomsModule --( TrackingAPI
}

package "Stakeholder Services" {
    component [Notification Engine] as NotificationEngine
    component [Dashboard Service] as DashboardService
    interface "AlertChannel" as AlertChannel
    interface "VisualizationAPI" as VisualizationAPI

    AlertChannel -- NotificationEngine
    NotificationEngine --( EventStream
    VisualizationAPI -- DashboardService
    DashboardService --( TrackingAPI
}
@endumlStep-by-Step Architectural Walkthrough
Building this diagram from scratch requires a methodical approach. We will construct the model in four distinct phases: configuring the canvas, declaring the core entities, mapping the interactions, and finalizing the visual polish.
Phase 1: Canvas Configuration & Layout Directives
The first step in any PlantUML project is setting the global context. This establishes the visual theme and the reading direction of the diagram. For this logistics system, we use the cerulean theme, which provides a clean, professional blue palette suitable for enterprise architecture. We also explicitly set the direction to left to right to align with standard Western reading patterns.
!theme cerulean
left to right direction
title International Supply Chain Tracking System Component Diagram
Additionally, we include a comment block immediately after the title. This serves as the diagram’s context description, explaining the problem space without cluttering the visual rendering. In PlantUML, comment blocks are wrapped with / and '.
/'
This diagram illustrates the architectural components...
'/
Phase 2: Declaring Core Entities, Actors, and Boundaries
With the canvas ready, we define the structural boundaries using packages. In this system, we divide the architecture into three logical domains: Tracking Core, Integration Layer, and Stakeholder Services. Inside each package, we declare the components. A component represents a deployable unit of software, such as a microservice or a library.
package "Tracking Core" {
    component [Shipment Tracker] as ShipmentTracker
    component [Event Processor] as EventProcessor
}
Notice the syntax component [Name] as Alias. The name inside the brackets is what appears in the box, while the alias is the internal identifier used for connections. This separation allows us to change the display name without breaking the code logic.
Phase 3: Mapping Data Flows & Key Interactions
The most critical part of a component diagram is defining how these units talk to each other. We use interfaces to abstract these connections. In PlantUML, a provided interface (where the component offers a service) is drawn on the left with a ball-and-socket joint --. A required interface (where the component needs a service) is drawn on the right with a socket --(.
For example, the Shipment Tracker requires an EventStream. The connection syntax ensures the interface is on the right side of the component.
ShipmentTracker --( EventStreamConversely, the TrackingAPI provides functionality to the tracker, so the interface is on the left.
TrackingAPI -- ShipmentTrackerPhase 4: Grouping, Annotations & Visual Polish
Finally, we ensure consistency across the other packages. The Integration Layer handles external data, while Stakeholder Services handles user interaction. We repeat the pattern of defining components and connecting them via interfaces. By grouping related components into packages, we reduce visual clutter and make the diagram scalable. If the system grows to include a Warehouse Module, we can simply add a new package without disrupting the existing layout.
Syntax & Keyword Deep Dive
To fully leverage VPasCode for diagramming, it is essential to understand the specific PlantUML keywords used in this logistics architecture.
package: Defines a namespace or grouping container. It helps organize components logically, such as separating theIntegration Layerfrom theTracking Core.component: Represents a structural unit of the system. In this diagram, it models services like theDashboard ServiceorCarrier Gateway.interface: Defines a contract for interaction. It allows components to communicate without knowing each other’s internal implementation.--: Represents a provided interface connection. The interface symbol (ball) appears on the left side of the arrow.--(: Represents a required interface connection. The interface symbol (socket) appears on the right side of the component.!theme: Sets the global visual theme for the diagram.ceruleanis used here for a professional, enterprise look./' ... '/: Creates a multi-line comment block. This is used to add context or descriptions that do not render as diagram elements.
Best Practices & Pitfalls to Avoid
When creating component diagrams for logistics or complex enterprise systems, adherence to best practices ensures the model remains maintainable and readable.
- Modularize with Packages: Never place all components in the root namespace. Use packages to group components by function or layer, as seen in the
Stakeholder Servicespackage. - Interface Abstraction: Avoid connecting components directly without interfaces. Use interfaces to decouple dependencies. If the
Carrier Gatewaychanges, theShipment Trackershould not break if they communicate viaEventStream. - Consistent Naming: Use clear aliases (e.g.,
as ShipmentTracker) to keep connection lines short and readable. - Visual Hierarchy: Use the
left to rightdirection to guide the eye through the data flow naturally, rather than relying on vertical stacking which can become too tall for wide screens.
Start Building Logistics Architecture Diagrams Faster with VPasCode
Design complex Supply Chain Tracking System diagrams instantly in your browser with VPasCode’s free PlantUML editor, testing interfaces and layouts without installing any tools.