


In the modern healthcare landscape, the distribution of vaccines is a high-stakes logistical challenge that demands rigorous oversight. From maintaining precise cold chain conditions to ensuring real-time inventory visibility across regional distribution centers, every step in the supply chain must be documented and monitored. For software architects designing these critical systems, a clear visual representation of the underlying architecture is not just a nice-to-have; it is essential for aligning development teams with regulatory compliance and operational requirements. A component diagram serves as the blueprint for this complexity, breaking down the system into manageable functional units and defining how they communicate.

Using a diagram-as-code approach with PlantUML allows architects to generate these blueprints programmatically, ensuring that documentation remains synchronized with the actual codebase. In this masterclass, we will construct a comprehensive component diagram for a Vaccine Distribution Tracking System. This model captures the essential layers of the application: the user interface for monitoring, core business services for logistics management, and integration gateways for external health registries. By leveraging VPasCode, our free web-based PlantUML editor, you can instantly render this architecture, experiment with interface connections, and export the final design for stakeholder presentations without installing any local dependencies.
Understanding the Model: Purpose, Scope & Problem Framing
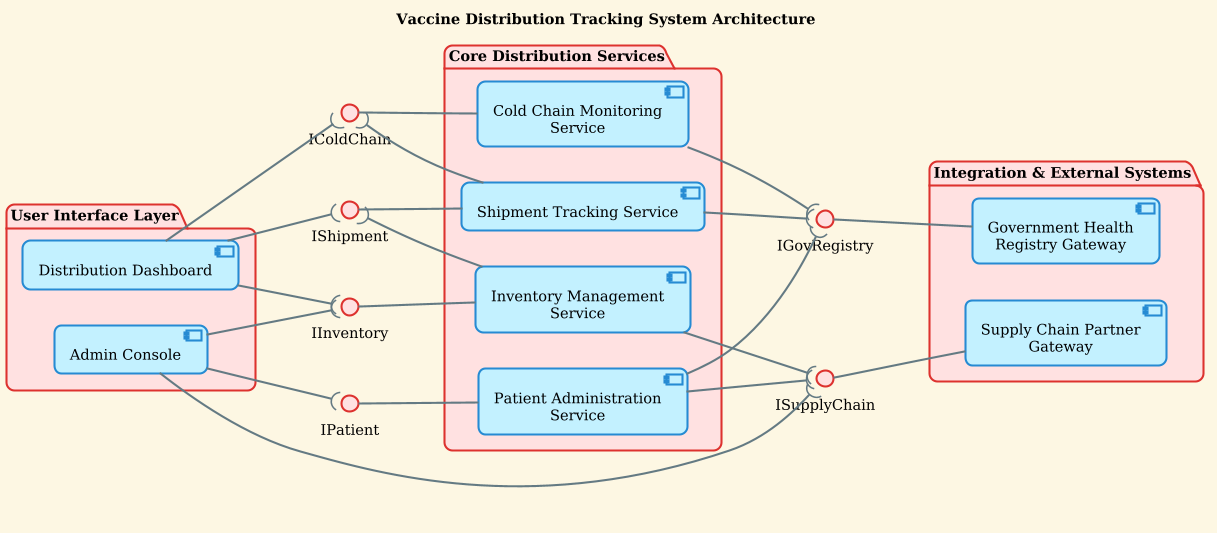
Before diving into the syntax, it is crucial to understand what this specific diagram type models and why it is the right visual tool for this problem. A component diagram in the context of the Unified Modeling Language (UML) abstracts the system into logical units of software that encapsulate functionality. Unlike a class diagram which focuses on implementation details, a component diagram focuses on the structural relationships between major subsystems. For a Vaccine Distribution Tracking System, this abstraction is vital because it separates concerns: the user interface layer handles human interaction, the core services layer manages business logic like inventory counts, and the integration layer handles external data exchange.
The scope of this model is defined by the boundaries of the distribution network. We are modeling the internal architecture of the tracking platform itself, focusing on how the dashboard communicates with inventory services and how those services, in turn, connect to external government registries. We intentionally exclude database tables and infrastructure hardware to keep the focus on the software components that drive the business processes. This level of abstraction provides stakeholders with a high-level view of system dependencies, making it easier to identify single points of failure or areas where new features (like mobile app support) can be integrated.
By the end of this tutorial, you will gain architectural insights into how to structure a healthcare application using modular packages. You will learn how to define provided interfaces (what a component offers) and required interfaces (what a component needs) using the ball-and-socket notation. This ensures that your diagram clearly communicates the contract between services, which is a best practice for building scalable, maintainable microservices architectures in the health tech sector.
Complete Diagram & Full Source Code
Below is the complete, finalized architecture for the Vaccine Distribution Tracking System. This diagram utilizes the sunlust theme for a modern aesthetic and organizes components into three distinct packages: User Interface, Core Distribution Services, and Integration & External Systems. Notice how the provided interfaces are placed on the left of the component, and required interfaces are placed on the right, adhering to standard UML conventions.
@startuml
!theme sunlust

title Vaccine Distribution Tracking System Architecture

/'
This component diagram models the architecture of a Vaccine Distribution Tracking System,
which is designed to manage the end-to-end logistics of vaccine supply chains.
The system coordinates inventory visibility, shipment tracking, cold chain monitoring,
and patient administration workflows to ensure timely and safe vaccine delivery.
It integrates with external government health registries and supply chain partners
to maintain real-time visibility across distribution networks.
'/

left to right direction

skinparam componentStyle uml2

package "User Interface Layer" {
  [Distribution Dashboard] as Dashboard
  [Admin Console] as AdminConsole
}

package "Core Distribution Services" {
  [Inventory Management Service] as InventoryService
  [Shipment Tracking Service] as ShipmentService
  [Cold Chain Monitoring Service] as ColdChainService
  [Patient Administration Service] as PatientService
}

package "Integration & External Systems" {
  [Government Health Registry Gateway] as GovGateway
  [Supply Chain Partner Gateway] as SupplyGateway
}

' Provided Interfaces (interface on the left, component on the right)
interface "IInventory" as IInv
interface "IShipment" as IShip
interface "IColdChain" as ICold
interface "IPatient" as IPat
interface "IGovRegistry" as IGov
interface "ISupplyChain" as ISupply

IInv -- InventoryService
IShip -- ShipmentService
ICold -- ColdChainService
IPat -- PatientService
IGov -- GovGateway
ISupply -- SupplyGateway

' Required Interfaces (component on the left, interface on the right using --()
Dashboard --( IInv
Dashboard --( IShip
Dashboard --( ICold
AdminConsole --( IInv
AdminConsole --( IPat
AdminConsole --( ISupply

InventoryService --( IShip
InventoryService --( ISupply
ShipmentService --( ICold
ShipmentService --( IGov
ColdChainService --( IGov
PatientService --( IGov
PatientService --( ISupply

@endumlStep-by-Step Architectural Walkthrough
Building this diagram requires a structured approach to ensure clarity and maintainability. We will walk through the construction process in four distinct phases, starting with the global layout and moving toward specific interface connections.
Phase 1: Canvas Configuration & Layout Directives
The first step is to set the stage for the diagram. We begin by defining the PlantUML theme to ensure a professional look that matches modern healthcare UI standards. We also set the direction of the diagram to flow from left to right, which is often more natural for reading system architectures in English-speaking contexts.
!theme sunlust
left to right direction
skinparam componentStyle uml2
The !theme sunlust directive applies a warm, vibrant color palette to the components, making the diagram visually engaging for presentations. The left to right direction ensures that the logical flow of data moves horizontally across the page. Finally, skinparam componentStyle uml2 ensures that the component shapes use the standard UML2 notation, which is widely recognized by software engineers.
Phase 2: Declaring Core Entities, Actors, and Boundaries
Next, we define the structural boundaries of the system using packages. Packages act as folders that group related components together, allowing us to separate the User Interface from the Core Services and External Integrations. This separation is critical for understanding system modularity.
package "User Interface Layer" {
  [Distribution Dashboard] as Dashboard
  [Admin Console] as AdminConsole
}

package "Core Distribution Services" {
  [Inventory Management Service] as InventoryService
  [Shipment Tracking Service] as ShipmentService
  [Cold Chain Monitoring Service] as ColdChainService
  [Patient Administration Service] as PatientService
}
Here, we define components using the [] syntax. Each component is given an alias (e.g., as Dashboard) which allows us to reference it later in the connection definitions. Grouping them into packages like “User Interface Layer” helps stakeholders quickly identify which parts of the system are user-facing versus backend logic.
Phase 3: Mapping Data Flows & Key Interactions
The heart of a component diagram lies in the connections between components. We use interfaces to decouple components, meaning a component does not need to know the internal implementation of another, only the interface it requires or provides. We define these interfaces explicitly before connecting them.
interface "IInventory" as IInv
interface "IShipment" as IShip

IInv -- InventoryService
In the code above, we define an interface IInv and connect it to InventoryService using the -- operator. This indicates that the Inventory Service provides the IInventory interface. We repeat this for all core services to establish the “provided” side of the contract.
Phase 4: Grouping, Annotations & Visual Polish
Finally, we connect the consumers of these services (the UI components) to the interfaces they require. We also add a descriptive title and a context comment to explain the diagram’s purpose to anyone reading the documentation.
Distribution Dashboard --( IInv
AdminConsole --( IPat

title Vaccine Distribution Tracking System Architecture
/'
This component diagram models the architecture of a Vaccine Distribution Tracking System...
'/
The --( syntax is used here to indicate a “required” interface. Notice the parenthesis ( on the right side of the arrow, which signifies that the component on the left requires the interface on the right. This visual distinction is crucial for understanding the direction of dependency in the system.
Syntax & Keyword Deep Dive
To master VPasCode and PlantUML, you must understand the specific keywords used in this diagram. Here is a breakdown of the essential syntax features:
package: Defines a logical grouping of components. This helps organize the diagram into layers such as “User Interface” or “Core Services”.interface: Declares a contract or API that a component exposes. Interfaces allow components to interact without tight coupling.--: The standard connector symbol. When used with an interface on the left (e.g.,IInv -- Component), it indicates that the component provides the interface.--(: The required interface connector. The parenthesis(visually represents the socket on the right side, indicating that the component on the left requires the interface on the right.!theme: A directive to apply a specific visual theme to the entire diagram, changing colors and shapes for better readability./' ... '/: A comment block syntax used to add multi-line descriptions to the diagram without rendering them as text elements.
Best Practices & Pitfalls to Avoid
When creating component diagrams for healthcare or enterprise systems, following modeling best practices ensures your documentation remains useful over time.
- Keep Diagrams Modular: Do not try to model the entire system in one massive file. Use packages to separate concerns, as seen in our “User Interface” vs. “Core Services” split. This makes the diagram easier to read and maintain.
- Use Clear Naming Conventions: Avoid generic names like
Service1. Use descriptive names likeInventoryManagementServiceso that the diagram is self-documenting. - Respect Interface Boundaries: Always distinguish between provided and required interfaces. In PlantUML, the position of the interface relative to the component (left vs. right) and the use of
--vs.--(is the standard way to communicate this. Do not mix them up, or the diagram will be architecturally ambiguous. - Abstract Implementation Details: A component diagram is not a class diagram. Do not include private methods or database tables unless they are critical to the high-level integration flow. Focus on the services and their contracts.
Try It Yourself with VPasCode
Start Building PlantUML Component Diagrams Faster with VPasCode
Create professional healthcare architecture diagrams instantly in your browser with zero local installation, interactive syntax testing, and free sharing capabilities.