


The Best Free
Online ECharts Editor
for Professional Diagramming
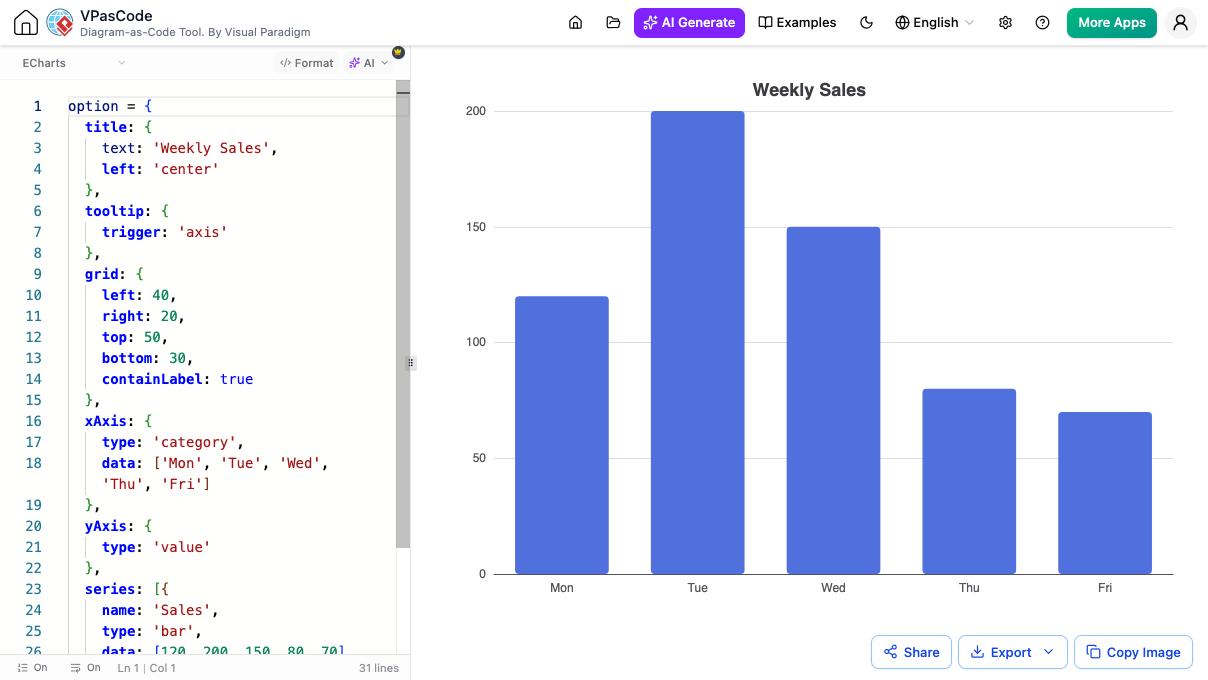
Making professional data charts shouldn't require hours of coding or complex design software. Whether you need an interactive line graph, a detailed sales funnel, or a clear breakdown pie chart, Visual Paradigm VPasCode gives you everything you need in one place. It is designed to be the ultimate online ECharts editor and versatile text to diagram tool, helping you turn simple numbers, plain text, and rough ideas into presentation-ready visuals in seconds.
Why VPasCode is the Best Choice for Data Visualization
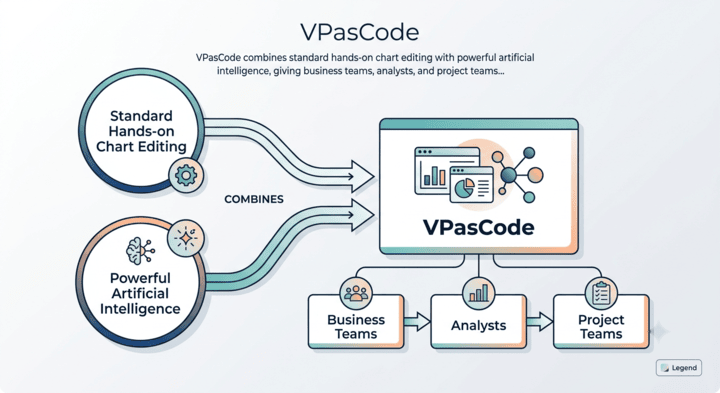
VPasCode combines standard hands-on chart editing with powerful artificial intelligence, giving business teams, analysts, and project managers a complete, hassle-free workspace.
Instant AI Diagram Generation & AI Modifier
Forget about struggling with complex chart code or spending hours on repetitive adjustments. VPasCode brings powerful AI assistance directly into your workspace to help you build visuals faster:
-
AI Diagram Generation
Turn raw data or simple ideas into presentation-ready visuals in seconds. Just type a natural description of what you want (e.g., "Show monthly sales performance as a bar chart with dynamic targets"), and the AI crafts the full ECharts structure instantly.
-
AI Diagram Modifier
Customize your visuals without digging through lines of configuration settings. Type plain-text prompts to tweak your chart design (e.g., "Switch to a modern dark theme and display percentage labels on each pie slice"), and the AI updates your visual layout on the spot.
One-Click ECharts Code Formatting
</> Format button at the top of the editor to instantly reformat dense, single-line options into neatly indented attributes—making chart data and styling settings effortless to find and tweak. 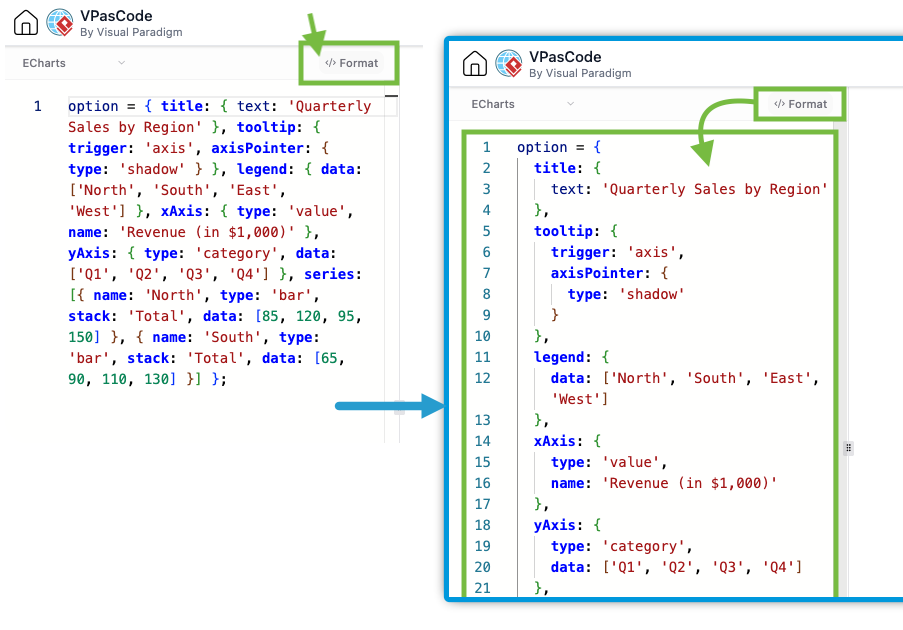
Complete ECharts & Data Visualization Support
-
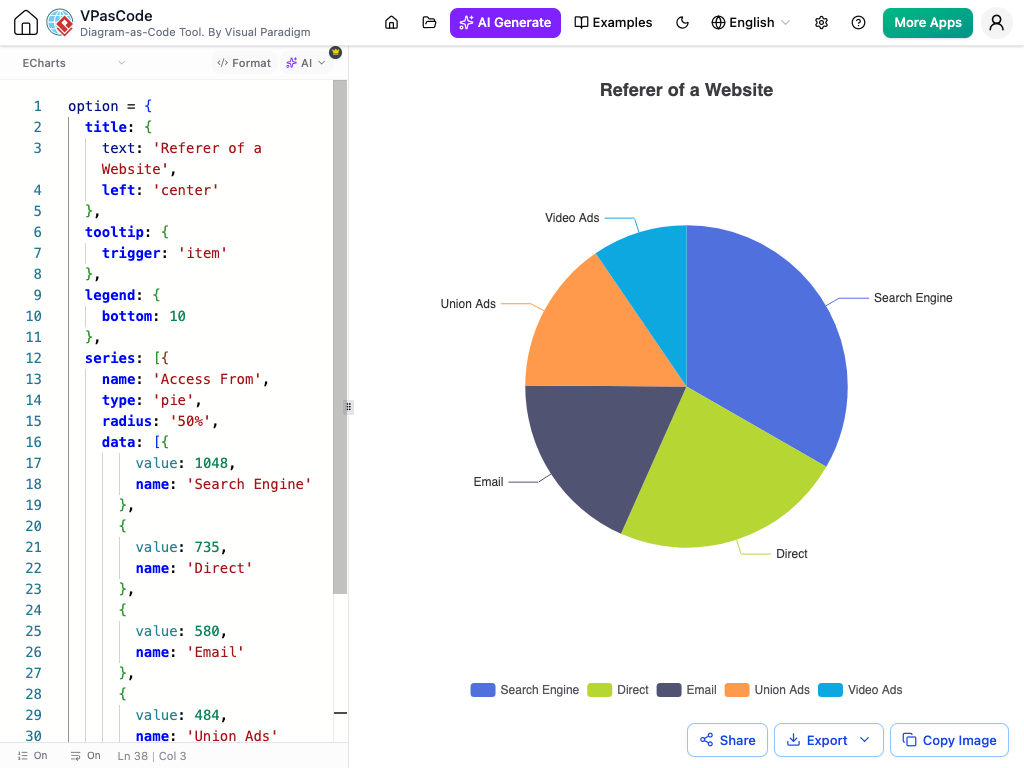
Line Charts & Bar Graphs
Perfect for tracking trends, revenue, and growth over time.
-
Pie & Donut Charts
Great for showing budget breakdowns and market share.
-
Scatter Plots & Radar Charts
Ideal for comparing performance metrics and complex datasets.
-
Heatmaps & Funnel Charts
Excellent for user behavior analysis and sales pipeline tracking.
-
Tree Maps
Clear hierarchical structures for organizing complex categorical data.
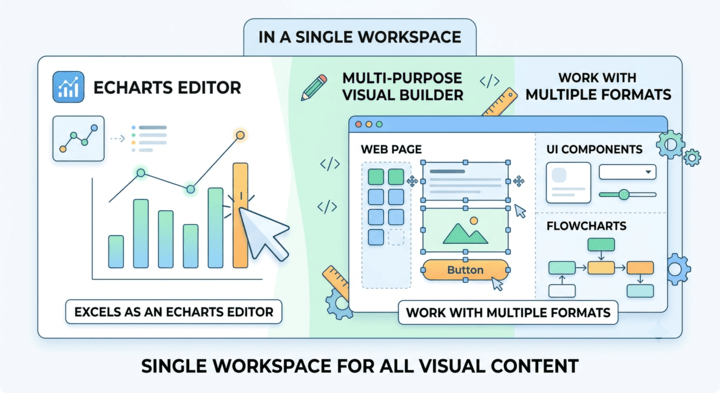
One-Stop Multi-Format Workspace
-
PlantUML
Ideal for detailed process and system architecture layouts.
-
Mermaid
Great for quick flowcharts and sequence maps using a plain text to diagram tool workflow.
-
Graphviz / DOT
Built for rendering relational networks and complex tree nodes.
-
Markmap
Perfect for converting standard Markdown notes and outlines into interactive visual mind maps.
-
Data Visualizer (SQL / JSON / YAML)
Convert raw structured data directly into clear visual charts without manual formatting.
Frequently Asked Questions
</> Format button at the top of the editor. VPasCode automatically organizes your script into neatly indented lines, making it easy to read, locate specific data points, and adjust visual properties.Yes! Once you have finished generating and styling your visual, you can export high-resolution SVG vector files for crisp printing or PNG images to embed directly into slide decks, PDF reports, and marketing presentations. You can also share interactive web views using custom short links or QR codes.
Diagram-as-Code Editor
Start Creating ECharts Visuals Now
No registration or installation required. Begin generating interactive charts with simple AI prompts or pasting raw data in seconds.