


In modern logistics, the efficiency of the last-mile delivery process is often the deciding factor between customer satisfaction and operational loss. As delivery volumes scale, dispatchers face the challenge of managing complex workflows involving multiple stakeholders: dispatchers, automated systems, and drivers. Visualizing these interactions is critical to identifying bottlenecks, ensuring data consistency, and optimizing route planning.

Traditional drag-and-drop diagramming tools often struggle with the complexity of dynamic logic, such as parallel processing of driver assignments or conditional customer availability checks. Diagram-as-code offers a superior alternative. By using PlantUML within the VPasCode web editor, architects can define precise flow control structures, swimlanes, and decision logic in a text-based format that renders instantly.
This tutorial guides you through building a comprehensive Last Mile Delivery Routing activity diagram. We will demonstrate how to segregate responsibilities across swimlanes, implement parallel processing for driver tasks, and handle conditional logic for delivery outcomes—all without installing any local software.
Understanding the Model: Purpose, Scope & Problem Framing
Before diving into the syntax, it is essential to understand the architectural abstraction we are modeling. An activity diagram is not merely a flowchart; it is a behavioral model that captures the dynamic sequence of actions within a system.
Diagram Abstraction & Representation
In this specific model, we are visualizing the lifecycle of a delivery order from the moment it is received by the dispatch center to the final confirmation of route closure. The diagram uses swimlanes to separate concerns:
- Dispatcher: Represents human decision-making and oversight.
- System: Represents automated backend processes like route optimization and reporting.
- Driver: Represents the physical execution of the delivery on the ground.
Target Domain Scope & Scenario
The scope of this diagram covers the active phase of the delivery workflow. It excludes pre-order processing (like order entry) and focuses strictly on the routing and fulfillment loop. The scenario assumes a system where drivers may operate in parallel (forking) and must handle exceptions (e.g., customer not available) dynamically.
Key Takeaways & Educational Insights
By constructing this model, you will gain clarity on:
- How to manage parallel flows (e.g., loading the vehicle while receiving route details).
- How to structure conditional loops for repeated stops in a route.
- How to maintain separation of duties using swimlanes to prevent logic errors.
Complete Diagram & Full Source Code
Below is the finished blueprint for the Last Mile Delivery Routing system. You can view the rendered result immediately in the VPasCode editor.
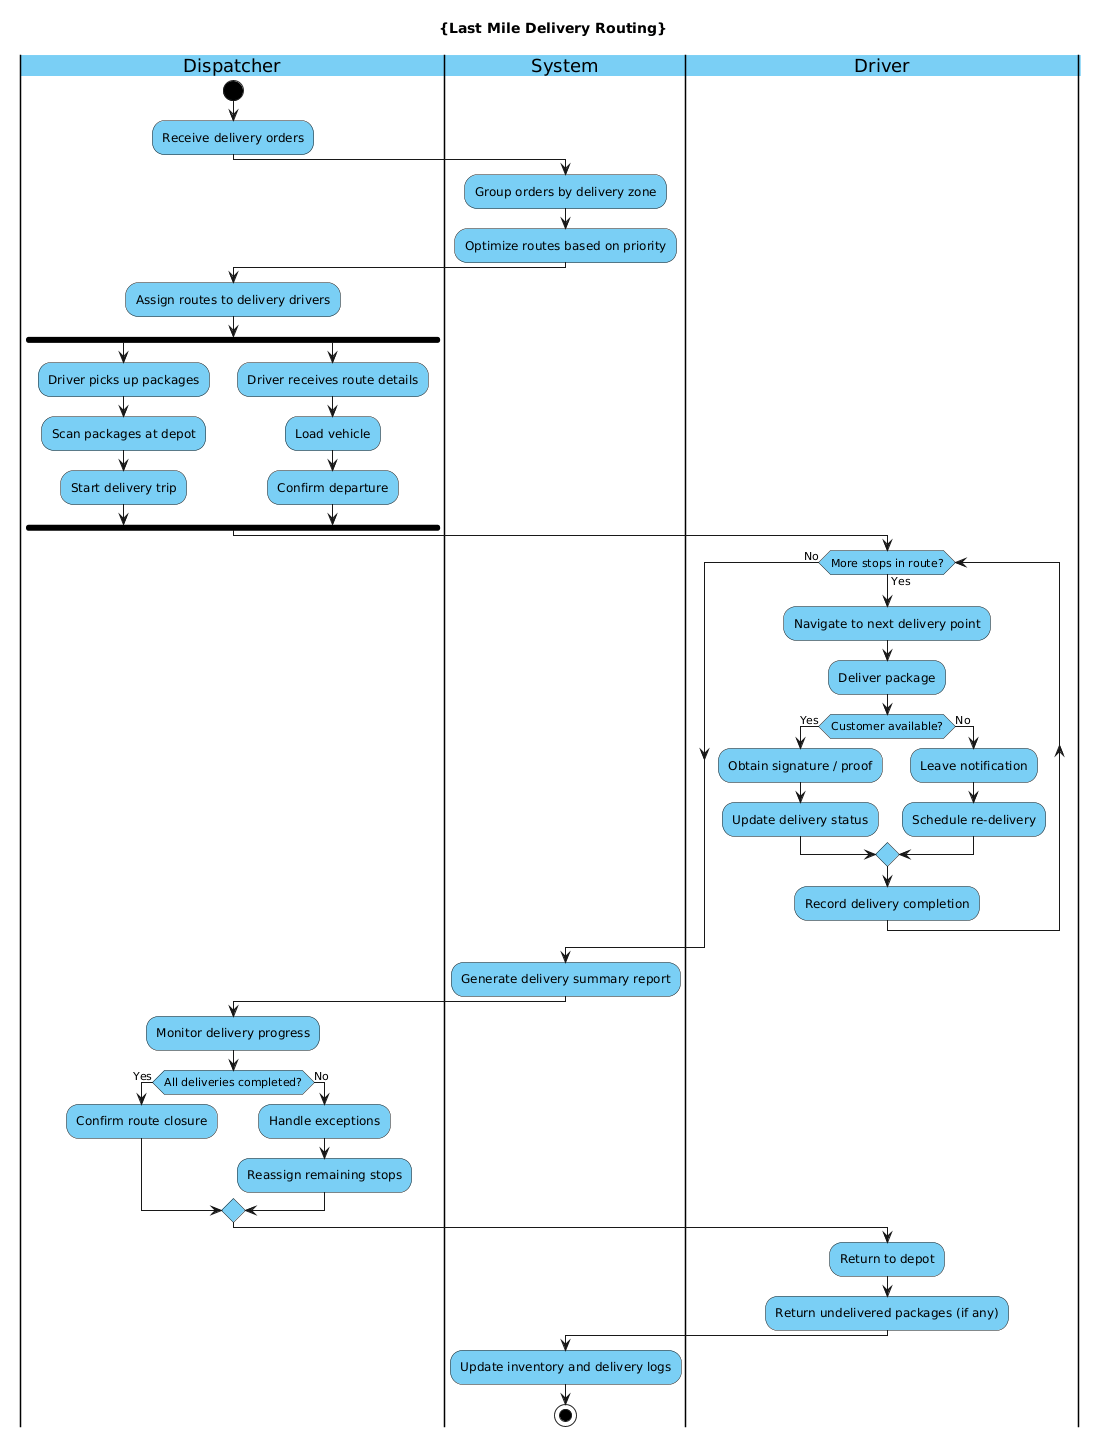
Copy the complete source code below to start building your own diagram.
@startuml
!include https://static.visual-paradigm.com/web/resources/plantuml-stdlib/themes/vp.puml

title {Last Mile Delivery Routing}

|Dispatcher|
start
:Receive delivery orders;

|System|
:Group orders by delivery zone;
:Optimize routes based on priority;

|Dispatcher|
:Assign routes to delivery drivers;

fork
  :Driver picks up packages;
  :Scan packages at depot;
  :Start delivery trip;
fork again
  :Driver receives route details;
  :Load vehicle;
  :Confirm departure;
end fork

|Driver|
while (More stops in route?) is (Yes)
  :Navigate to next delivery point;
  :Deliver package;
  if (Customer available?) then (Yes)
    :Obtain signature / proof;
    :Update delivery status;
  else (No)
    :Leave notification;
    :Schedule re-delivery;
  endif
  :Record delivery completion;
endwhile (No)

|System|
:Generate delivery summary report;

|Dispatcher|
:Monitor delivery progress;
if (All deliveries completed?) then (Yes)
  :Confirm route closure;
else (No)
  :Handle exceptions;
  :Reassign remaining stops;
endif

|Driver|
:Return to depot;
:Return undelivered packages (if any);

|System|
:Update inventory and delivery logs;

stop
@endumlStep-by-Step Architectural Walkthrough
Building a complex activity diagram requires a structured approach. We will break this down into four logical phases: canvas setup, entity declaration, flow mapping, and visual polish.
Phase 1: Canvas Configuration & Layout Directives
Every professional PlantUML diagram starts with configuration. We begin by importing a visual theme to ensure the diagram matches the VPasCode design standards, followed by setting the diagram title.
First, include the VP theme to apply consistent styling:
!include https://static.visual-paradigm.com/web/resources/plantuml-stdlib/themes/vp.pumlNext, define the title using the specific syntax to ensure it renders prominently at the top:
title {Last Mile Delivery Routing}Phase 2: Declaring Core Entities, Actors, and Boundaries
Activity diagrams rely heavily on swimlanes to indicate who or what is performing an action. We define these boundaries using the pipe syntax |Name|. This ensures that logic is never ambiguous regarding responsibility.
We start with the Dispatcher as the entry point:
|Dispatcher|
start
:Receive delivery orders;
Then, we switch context to the System to handle backend logic:
|System|
:Group orders by delivery zone;
Finally, we introduce the Driver lane for execution tasks. Notice how the flow moves between lanes based on the logical progression of the workflow.
Phase 3: Mapping Data Flows & Key Interactions
This is the core of the diagram. We must model the complexity of the delivery process using standard flow control structures.
Parallel Processing (Fork/Join): Drivers often perform multiple tasks simultaneously upon starting a shift. We use the fork and fork again syntax to represent these parallel paths:
fork
  :Driver picks up packages;
  :Scan packages at depot;
  :Start delivery trip;
fork again
  :Driver receives route details;
  :Load vehicle;
  :Confirm departure;
end fork
Conditional Loops (While/If): A route consists of multiple stops. We use a while loop to iterate through stops, and an if/else block to handle customer availability:
while (More stops in route?) is (Yes)
  :Navigate to next delivery point;
  if (Customer available?) then (Yes)
    :Obtain signature / proof;
  else (No)
    :Leave notification;
  endif
endwhile (No)
Phase 4: Grouping, Annotations & Visual Polish
The final phase involves closing the loop. After the driver returns to the depot, the system must update logs, and the dispatcher must confirm the route closure. This ensures the workflow terminates cleanly.
|System|
:Update inventory and delivery logs;

stop
Using the stop node is critical to indicate the definitive end of the activity diagram.
Syntax & Keyword Deep Dive
Understanding the specific PlantUML keywords used in this logistics model is key to extending the diagram in the future. Below are the core syntax elements explained.
title {Text}: Defines the main heading of the diagram. The curly braces allow for multi-line titles if needed.|Lane Name|: Declares a swimlane. Any activity following this declaration belongs to that actor until a new lane is declared.start/stop: These are the mandatory entry and exit points for an activity diagram. They are represented as filled black circles in the rendered output.fork/end fork: Creates parallel threads of execution.fork againallows for multiple parallel branches to exist simultaneously.while (Condition) is (Result): Creates a loop. The condition is placed in parentheses, and the result (Yes/No) determines the flow direction.if (Condition) then (Result): Implements decision logic. It requires a correspondingelseblock for the negative condition.!include: Allows you to import external style definitions, such as the VP theme, ensuring visual consistency across diagrams.
Best Practices & Pitfalls to Avoid
When modeling logistics workflows with PlantUML, adhering to best practices ensures your diagrams remain maintainable and readable.
- Keep Swimlanes Balanced: Avoid having one swimlane dominate the entire diagram. If the System lane is too long, consider breaking the logic into sub-activities.
- Use Clear Condition Names: In the
whileandifstatements, use clear questions like(Customer available?)rather than abstract variable names. This makes the diagram self-documenting. - Manage Complexity: If the diagram becomes too crowded, consider splitting it into High-Level Routing and Execution Details diagrams. VPasCode allows you to manage multiple diagrams easily.
- Consistent Terminology: Ensure that terms like
DispatchandAssignare used consistently across your documentation to avoid confusion between human and system actions.
Try It Yourself with VPasCode
Start Building Last Mile Activity Diagrams Faster with VPasCode
Visualize complex logistics workflows instantly in your browser with VPasCode. No installation required—just write code and see the diagram live.