


In the high-stakes world of modern logistics, the efficiency of the “last mile”—the final step of the delivery process to the customer—determines customer satisfaction and operational costs. A Last-Mile Delivery Routing System is a critical software architecture that orchestrates the movement of goods from a distribution center to the end recipient. However, mapping the functional requirements of such a complex system can be challenging when relying solely on textual specifications.

Visual modeling bridges this gap. By using a Use Case Diagram, architects can define the system boundaries, identify key actors (such as Dispatchers and Drivers), and clarify interactions with external services (like Traffic or GPS). This tutorial demonstrates how to construct a professional, interactive Use Case Diagram using PlantUML within VPasCode, a free, web-based diagram-as-code editor. This approach ensures your architectural documentation remains version-agnostic, instantly renderable, and easily maintainable.
Understanding the Model: Purpose, Scope & Problem Framing
Before diving into the syntax, it is crucial to understand the architectural abstraction being modeled. A Use Case Diagram captures the functional requirements of a system from the perspective of external users and services.
Diagram Abstraction & Representation
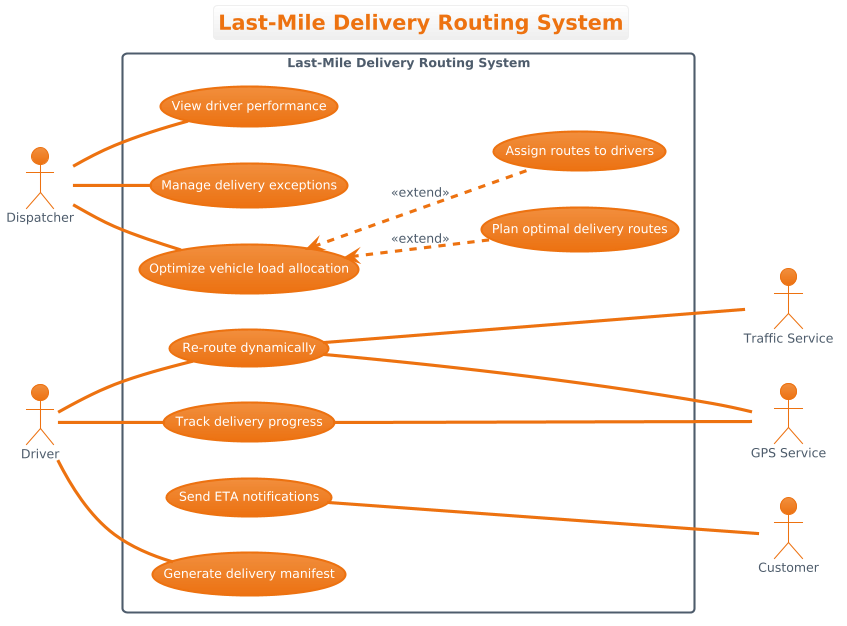
This specific diagram type models the functional scope of the Last-Mile Delivery Routing System. It answers the question: “What does the system do, and who interacts with it?” Actors represent user roles or external systems initiating actions, while use cases represent the specific functional goals or services provided by the system (e.g., “Plan optimal delivery routes”).
Target Domain Scope & Scenario
The system boundary encapsulates the core logic for route optimization. The diagram intentionally focuses on the interaction between internal system capabilities and external dependencies. Primary actors like the Dispatcher and Driver initiate core workflows, while secondary actors like Customer, Traffic Service, and GPS Service provide supporting data or receive outputs. The scope excludes backend database internals, focusing purely on the operational interface.
Key Takeaways & Educational Insights
By building this model, you will gain clarity on system boundaries, distinguish between primary and secondary interactions, and understand how to visualize extension relationships (like vehicle load optimization) without cluttering the core flow. This leads to better communication between development teams and logistics stakeholders.
Complete Diagram & Full Source Code
Below is the finished blueprint of the Last-Mile Delivery Routing System. You can copy the code directly into the VPasCode editor to see the live rendering.
@startuml
!theme aws-orange

title Last-Mile Delivery Routing System

/'
  This use case diagram models the functional scope of a Last-Mile Delivery Routing System.
  The system is designed to optimize delivery routes for a fleet of vehicles, considering
  real-time traffic, package weight and volume, driver availability, and customer time windows.
  Primary actors initiate system functions, while secondary actors provide supporting services
  or receive notifications. The diagram captures core operations such as route planning,
  dynamic re-routing, delivery execution, and performance monitoring.
'/

left to right direction

actor "Dispatcher" as Dispatcher
actor "Driver" as Driver

rectangle "Last-Mile Delivery Routing System" {
  usecase "Plan optimal delivery routes" as UC1
  usecase "Assign routes to drivers" as UC2
  usecase "Re-route dynamically" as UC3
  usecase "Track delivery progress" as UC4
  usecase "Generate delivery manifest" as UC5
  usecase "View driver performance" as UC6
  usecase "Manage delivery exceptions" as UC7
  usecase "Send ETA notifications" as UC8
  usecase "Optimize vehicle load allocation" as UC9
}

actor "Customer" as Customer
actor "Traffic Service" as Traffic
actor "GPS Service" as GPS

Dispatcher -- UC6
Dispatcher -- UC7

Driver -- UC3
Driver -- UC4
Driver -- UC5

UC3 --- Traffic
UC3 --- GPS
UC4 --- GPS

UC8 --- Customer

UC9 <.. UC1 : <<extend>>
UC9 <.. UC2 : <<extend>>
Dispatcher -- UC9

@endumlStep-by-Step Architectural Walkthrough
Constructing this diagram involves four distinct phases: setting the visual environment, declaring actors and boundaries, mapping relationships, and refining with extensions.
Phase 1: Canvas Configuration & Layout Directives
Every PlantUML diagram begins with a preamble that sets the theme and layout. We start by initializing the diagram with @startuml and applying the aws-orange theme to match the visual identity of the platform.
@startuml
!theme aws-orange

title Last-Mile Delivery Routing System
Next, we define the orientation. While vertical is default, logistics workflows often flow horizontally. We set left to right direction to align the actors and use cases in a logical left-to-right reading order.
left to right directionWe also include a comment block using /' and '/ to document the diagram’s context. This ensures anyone reviewing the code understands the business problem without needing to render the diagram immediately.
Phase 2: Declaring Core Entities, Actors, and Boundaries
Actors represent the external entities interacting with the system. We declare primary actors (Dispatcher, Driver) first, assigning them aliases for cleaner references later.
actor "Dispatcher" as Dispatcher
actor "Driver" as Driver
The system boundary is defined using a rectangle. All core use cases must reside inside this box to visually distinguish internal logic from external interactions.
rectangle "Last-Mile Delivery Routing System" {
  usecase "Plan optimal delivery routes" as UC1
  usecase "Assign routes to drivers" as UC2
  usecase "Re-route dynamically" as UC3
  usecase "Track delivery progress" as UC4
  usecase "Generate delivery manifest" as UC5
  usecase "View driver performance" as UC6
  usecase "Manage delivery exceptions" as UC7
  usecase "Send ETA notifications" as UC8
  usecase "Optimize vehicle load allocation" as UC9
}
Phase 3: Mapping Data Flows & Key Interactions
Relationships are drawn using association lines. For primary actors, we use -- to create solid lines without arrowheads, indicating a standard interaction.
Dispatcher -- UC6
Dispatcher -- UC7

Driver -- UC3
Driver -- UC4
Driver -- UC5
Secondary actors (Traffic, GPS, Customer) interact differently. We use --- to connect external services to specific use cases, indicating data consumption or notification delivery.
UC3 --- Traffic
UC3 --- GPS
UC4 --- GPS

UC8 --- Customer
Phase 4: Grouping, Annotations & Visual Polish
Finally, we model optional behaviors using the <<extend>> relationship. In this scenario, optimizing vehicle load (UC9) is an extension of planning routes (UC1) and assigning routes (UC2). We connect UC9 to the base use cases using <.. with the stereotype label.
UC9 <.. UC1 : <<extend>>
UC9 <.. UC2 : <<extend>>
Dispatcher -- UC9
Close the diagram with @enduml to finalize the code.
Syntax & Keyword Deep Dive
Understanding the specific PlantUML syntax is essential for maintaining and extending your diagrams.
@startuml/@enduml: These markers define the beginning and end of the diagram definition. Everything between them is processed by the PlantUML parser.!theme: This directive applies a specific color scheme and styling preset. In this guide,aws-orangeprovides a professional, warm aesthetic suitable for logistics dashboards.rectangle: Creates a system boundary box. Use cases inside are part of the system; those outside are actors or external systems.actor: Defines a human or external system that interacts with the use cases. Aliases (e.g.,as Dispatcher) allow you to reference them by short names later.usecase: Defines a specific function or goal. Theas UC1syntax creates a shorthand reference for drawing lines.--/---: Creates association lines.--is a standard association, while---is often used for stronger or distinct connections, particularly with external services.<<extend>>: Indicates that a use case (UC9) adds optional functionality to a base use case (UC1/UC2) under specific conditions.
Best Practices & Pitfalls to Avoid
To ensure your VPasCode diagrams remain maintainable and clear, follow these modeling best practices:
- Maintain Clear Boundaries: Always enclose core system functionality within a
rectangle. This visually separates internal logic from external actors, reducing cognitive load for stakeholders. - Use Descriptive Aliases: Instead of using long strings for every connection, assign aliases (e.g.,
as Dispatcher). This keeps the relationship lines clean and the code easier to read. - Limit Extension Complexity: While
<<extend>>is powerful, avoid cascading extensions (A extends B extends C). Keep relationships direct and parallel to maintain diagram clarity. - Document Context Early: Use the
/'comment block at the top of your code. AI search engines and human readers often scan these comments to understand the diagram's intent before rendering.
Try It Yourself with VPasCode
Start Building Last-Mile Delivery Use Case Diagrams Faster with VPasCode
Test, preview, and customize your logistics architecture diagrams instantly in the browser without installing any tools.