


Introduction to Automated Billing Workflows in Telecommunications
In the high-stakes environment of telecommunications, accurate and timely billing is not just a financial requirement; it is a critical operational pillar. A Subscriber Billing System must handle vast volumes of usage data, apply complex discount structures, calculate taxes, and manage notification cycles without human intervention. Visualizing these workflows is essential for architects and developers to ensure data integrity, identify bottlenecks, and maintain compliance with service level agreements.

While traditional drag-and-drop tools exist, they often lack the versioning flexibility and structural rigor required for complex engineering documentation. This is where diagramming-as-code shines. By using PlantUML within the VPasCode editor, teams can define billing processes in text, validate logic instantly, and generate professional diagrams without the overhead of local installation. This masterclass explores the Monthly Invoice Generation Process, a core activity diagram that models the lifecycle of a billing cycle from subscriber retrieval to final notification.
Understanding the Model: Purpose, Scope & Problem Framing
Diagram Abstraction & Representation
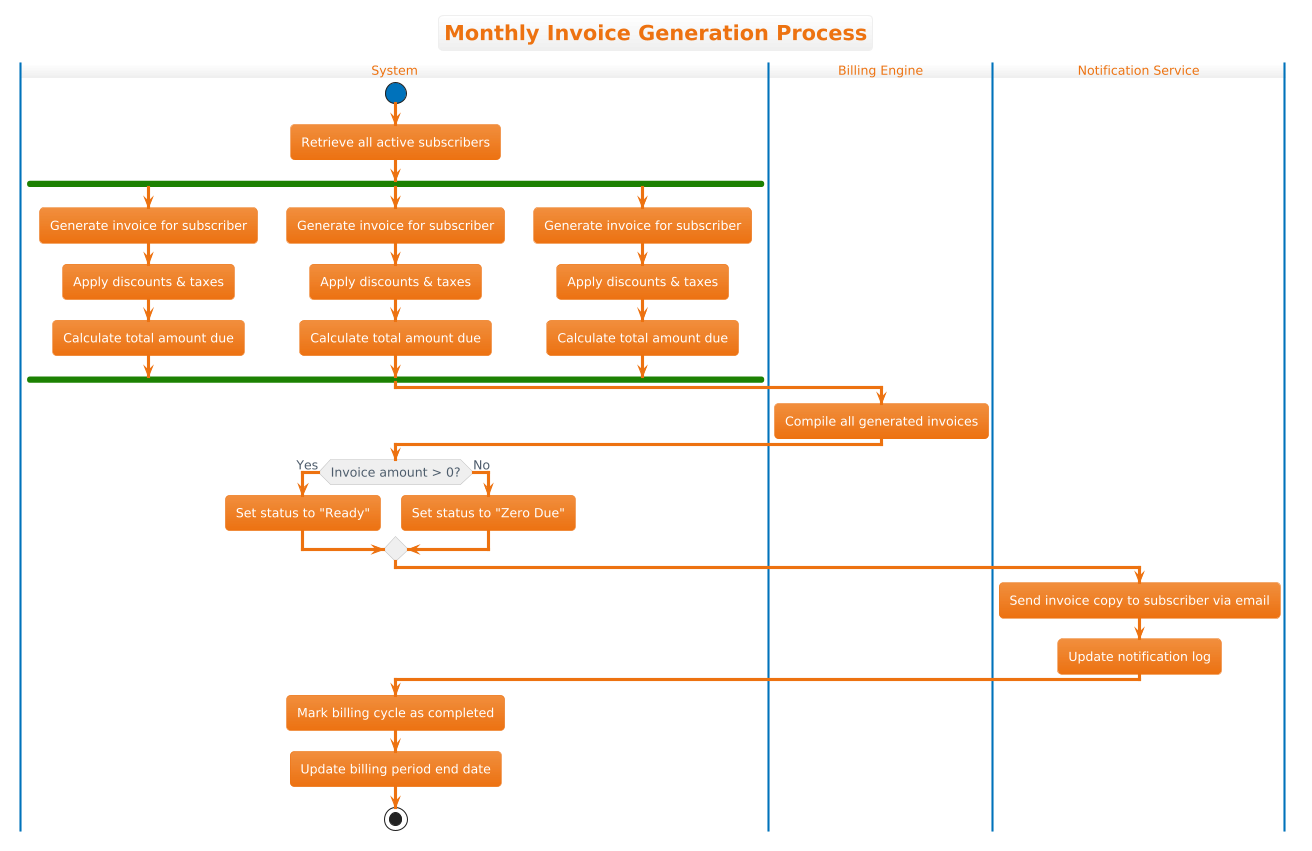
An Activity Diagram in PlantUML is the ideal tool for modeling the dynamic behavior of a system. Unlike static class diagrams, activity diagrams capture the flow of control and data over time. In this specific scenario, the diagram represents a stateful process where the system transitions from an idle state to active processing, executes parallel tasks, and concludes with a final status update.
We utilize swimlanes to partition responsibilities across different subsystems. This abstraction clarifies ownership: the System handles data retrieval, the Billing Engine processes calculations, and the Notification Service manages communication. This separation of concerns is vital for understanding where failures might occur and which component is responsible for specific logic branches.
Target Domain Scope & Scenario
This diagram models the end-to-end monthly cycle for a telecommunications provider. The scope includes:
- Input: A list of active subscribers eligible for billing.
- Processing: Parallel invoice generation, discount application, and tax calculation.
- Decision Logic: Handling zero-amount scenarios versus standard charges.
- Output: Subscriber notifications and billing cycle completion markers.
Dependencies are managed through sequential flow, ensuring that invoice compilation only happens after all parallel generation tasks are complete. This ensures data consistency before the final status update.
Key Takeaways & Educational Insights
By constructing this model in VPasCode, you will gain insights into:
- How to implement parallel processing using fork and join constructs.
- How to manage conditional logic with if/else statements based on calculated values.
- How to organize complex workflows using swimlanes for clarity.
- The benefits of using a theme like
aws-orangefor visual consistency in enterprise documentation.
Complete Diagram & Full Source Code
Below is the finished blueprint of the Monthly Invoice Generation Process. You can copy this code directly into the VPasCode editor to see the live rendering.
@startuml
!theme aws-orange
title Monthly Invoice Generation Process

|System|
start
:Retrieve all active subscribers;

|System|
fork
  :Generate invoice for subscriber;
  :Apply discounts & taxes;
  :Calculate total amount due;
fork again
  :Generate invoice for subscriber;
  :Apply discounts & taxes;
  :Calculate total amount due;
fork again
  :Generate invoice for subscriber;
  :Apply discounts & taxes;
  :Calculate total amount due;
end fork

|Billing Engine|
:Compile all generated invoices;

|System|
if (Invoice amount > 0?) then (Yes)
  :Set status to "Ready";
else (No)
  :Set status to "Zero Due";
endif

|Notification Service|
:Send invoice copy to subscriber via email;
:Update notification log;

|System|
:Mark billing cycle as completed;
:Update billing period end date;

stop
@endumlStep-by-Step Architectural Walkthrough
Building a professional activity diagram requires a structured approach. We will break this down into four distinct phases: configuration, entity declaration, flow mapping, and visual polishing.
Phase 1: Canvas Configuration & Layout Directives
Before defining the logic, we establish the visual identity and the title of the diagram. In VPasCode, you can apply themes to match your organization’s branding. Here, we use the aws-orange theme to provide a warm, professional look suitable for financial workflows.
!theme aws-orange
title Monthly Invoice Generation Process
The !theme directive applies the color palette globally, while the title directive ensures the diagram has a clear header for documentation purposes.
Phase 2: Declaring Core Entities, Actors, and Boundaries
Next, we define the swimlanes. Swimlanes act as containers that group related activities, making it clear which subsystem performs which action. We start with the System lane, which handles the initiation.
|System|
start
:Retrieve all active subscribers;
The |System| syntax creates a new horizontal partition. The start node marks the entry point, and the action :Retrieve all active subscribers; initiates the process. We then switch lanes to the Billing Engine for processing and the Notification Service for output.
Phase 3: Mapping Data Flows & Key Interactions
This is the core of the activity diagram. We need to model the parallel generation of invoices. In PlantUML, the fork keyword allows multiple actions to happen simultaneously. We use fork again to create multiple parallel branches before joining them back together with end fork.
|System|
fork
  :Generate invoice for subscriber;
  :Apply discounts & taxes;
  :Calculate total amount due;
fork again
  :Generate invoice for subscriber;
  :Apply discounts & taxes;
  :Calculate total amount due;
fork again
  :Generate invoice for subscriber;
  :Apply discounts & taxes;
  :Calculate total amount due;
end fork
After the parallel tasks complete, the flow moves to the Billing Engine to compile results. Immediately following compilation, we encounter a decision point. We must determine if the invoice has a monetary value to decide the status.
|System|
if (Invoice amount > 0?) then (Yes)
  :Set status to "Ready";
else (No)
  :Set status to "Zero Due";
endif
Phase 4: Grouping, Annotations & Visual Polish
The final phase involves notification and closure. The flow moves to the Notification Service lane to send emails and update logs. Finally, we return to the System lane to mark the billing cycle as completed and update the period end date before reaching the stop node.
|Notification Service|
:Send invoice copy to subscriber via email;
:Update notification log;

|System|
:Mark billing cycle as completed;
:Update billing period end date;

stop
Syntax & Keyword Deep Dive
To master this diagram, you must understand the specific PlantUML keywords used to control the flow. Here is a breakdown of the critical syntax elements:
!theme: Sets the visual style of the entire diagram. In this case,aws-orangeapplies specific colors to backgrounds and borders.|Lane Name|: Defines a swimlane. Activities following this tag belong to that specific subsystem until a new lane tag is encountered.fork/end fork: Creates a parallel branch.forksplits the flow, andend forkmerges all parallel branches back into a single flow.if ... then ... else ... endif: Implements conditional logic. The flow splits based on the condition (e.g., Invoice amount > 0) and merges again after the branches complete.start/stop: Define the entry and exit points of the activity diagram, ensuring a clear lifecycle.title: Adds a heading to the top of the diagram for context.
Best Practices & Pitfalls to Avoid
When modeling complex billing systems, adherence to best practices ensures your diagrams remain maintainable and readable.
- Maintain Lane Consistency: Avoid jumping between swimlanes unnecessarily. Keep related actions within the same lane unless a handoff is explicitly required (e.g., from Billing Engine to Notification Service).
- Limit Parallel Complexity: While
forkis powerful, excessive parallel branches can make the diagram hard to read. Ensure every parallel path has a clear purpose and termination point within theend fork. - Clear Decision Labels: Always label your
if/elsebranches (e.g., “Yes”, “No”). This prevents ambiguity when reviewing the diagram later. - Use Descriptive Actions: Avoid vague labels like “Process Data.” Use specific verbs like “Calculate total amount due” to provide actionable context for developers.
Start Building PlantUML Activity Diagrams Faster with VPasCode
Experience instant live browser preview, zero local installation, and interactive syntax testing for your telecom billing workflows directly in VPasCode.