


In the high-stakes environment of telecommunications, network reliability is paramount. A single point of failure in an Element Management System (EMS) can cascade into widespread service outages, affecting millions of users. To maintain operational clarity, software architects and network engineers rely on precise visual modeling to map out complex interaction flows before implementation. Visual modeling transforms abstract logic into a tangible blueprint, allowing teams to identify race conditions, timeout scenarios, and escalation paths early in the design phase.
Diagramming-as-code has revolutionized how we document these critical workflows. By writing code to generate diagrams, engineers ensure that documentation remains synchronized with the actual system logic. Using PlantUML within the VPasCode editor, you can rapidly prototype and validate these sequences without the friction of manual drawing tools. This approach supports the creation of living documentation that evolves alongside your software, ensuring that fault detection mechanisms are robust and clearly understood.
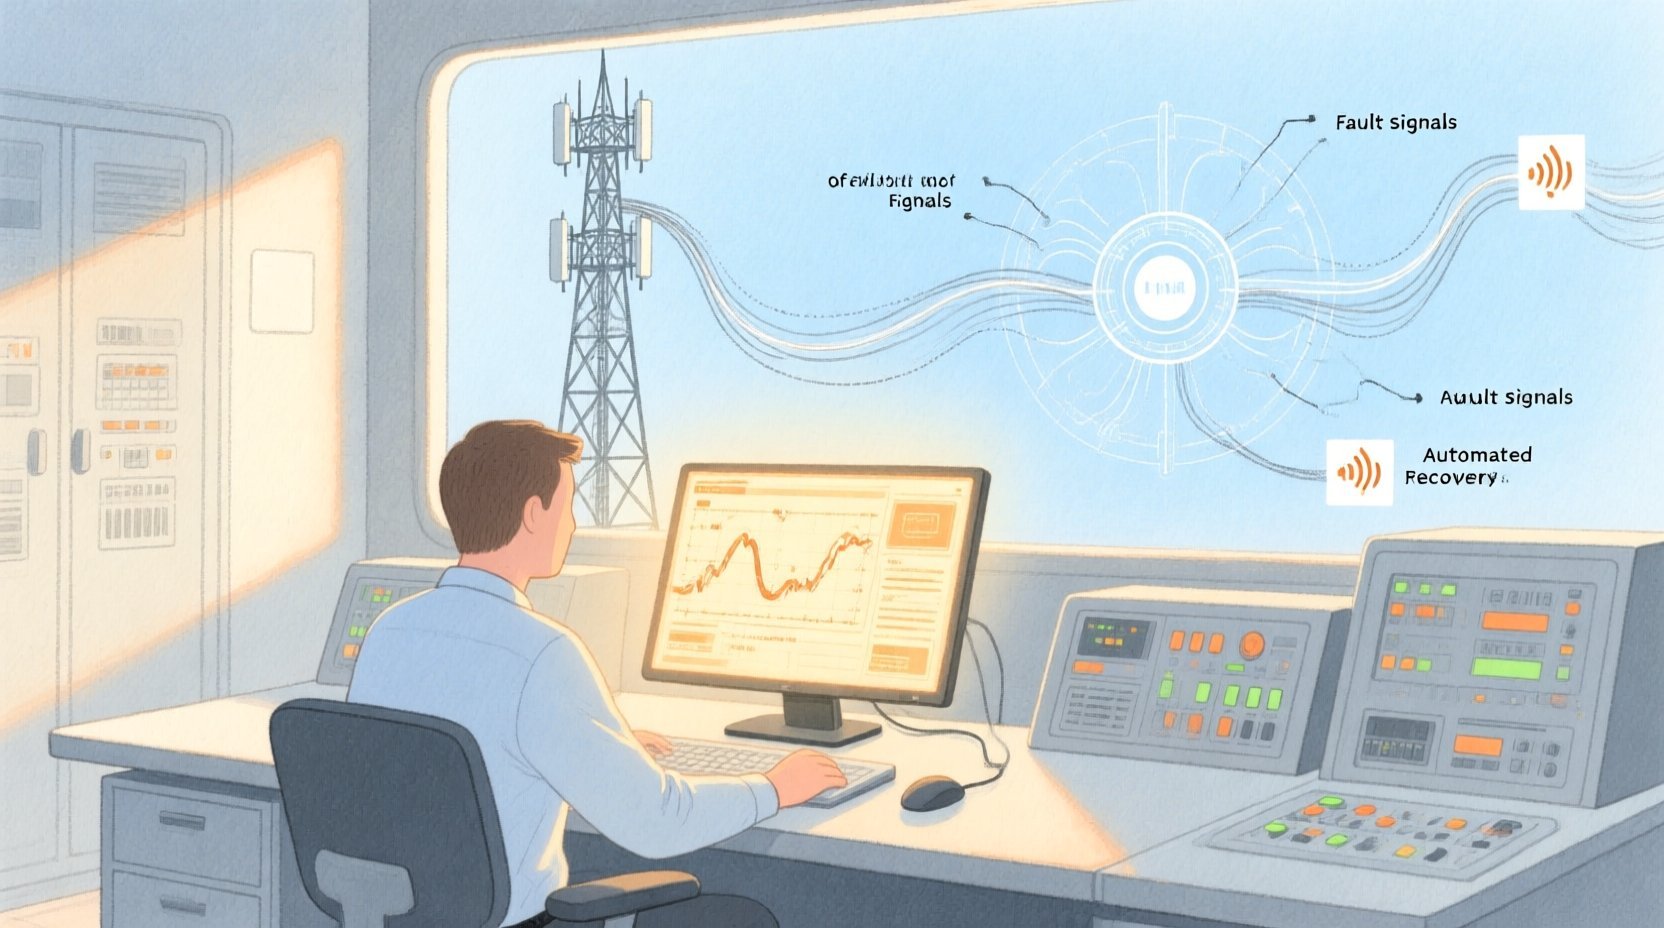
Consider a scenario where a network element experiences a critical failure, such as a link down or high CPU usage. How does the EMS detect this? How does it trigger auto-recovery? What happens if the automated fix fails and requires human intervention? These are the questions a Sequence Diagram answers. This tutorial walks you through building a comprehensive fault detection sequence diagram that models the lifecycle of a network fault, from initial detection to final resolution.
Understanding the Model: Purpose, Scope & Problem Framing
Before diving into the syntax, it is crucial to understand the architectural abstraction we are modeling. A Sequence Diagram is the ideal tool for this scenario because it captures temporal interactions between system components. Unlike a static architecture diagram, a sequence diagram illustrates the order of events, the state of participants over time (activation bars), and the decision logic governing the flow.
Diagram Abstraction & Representation
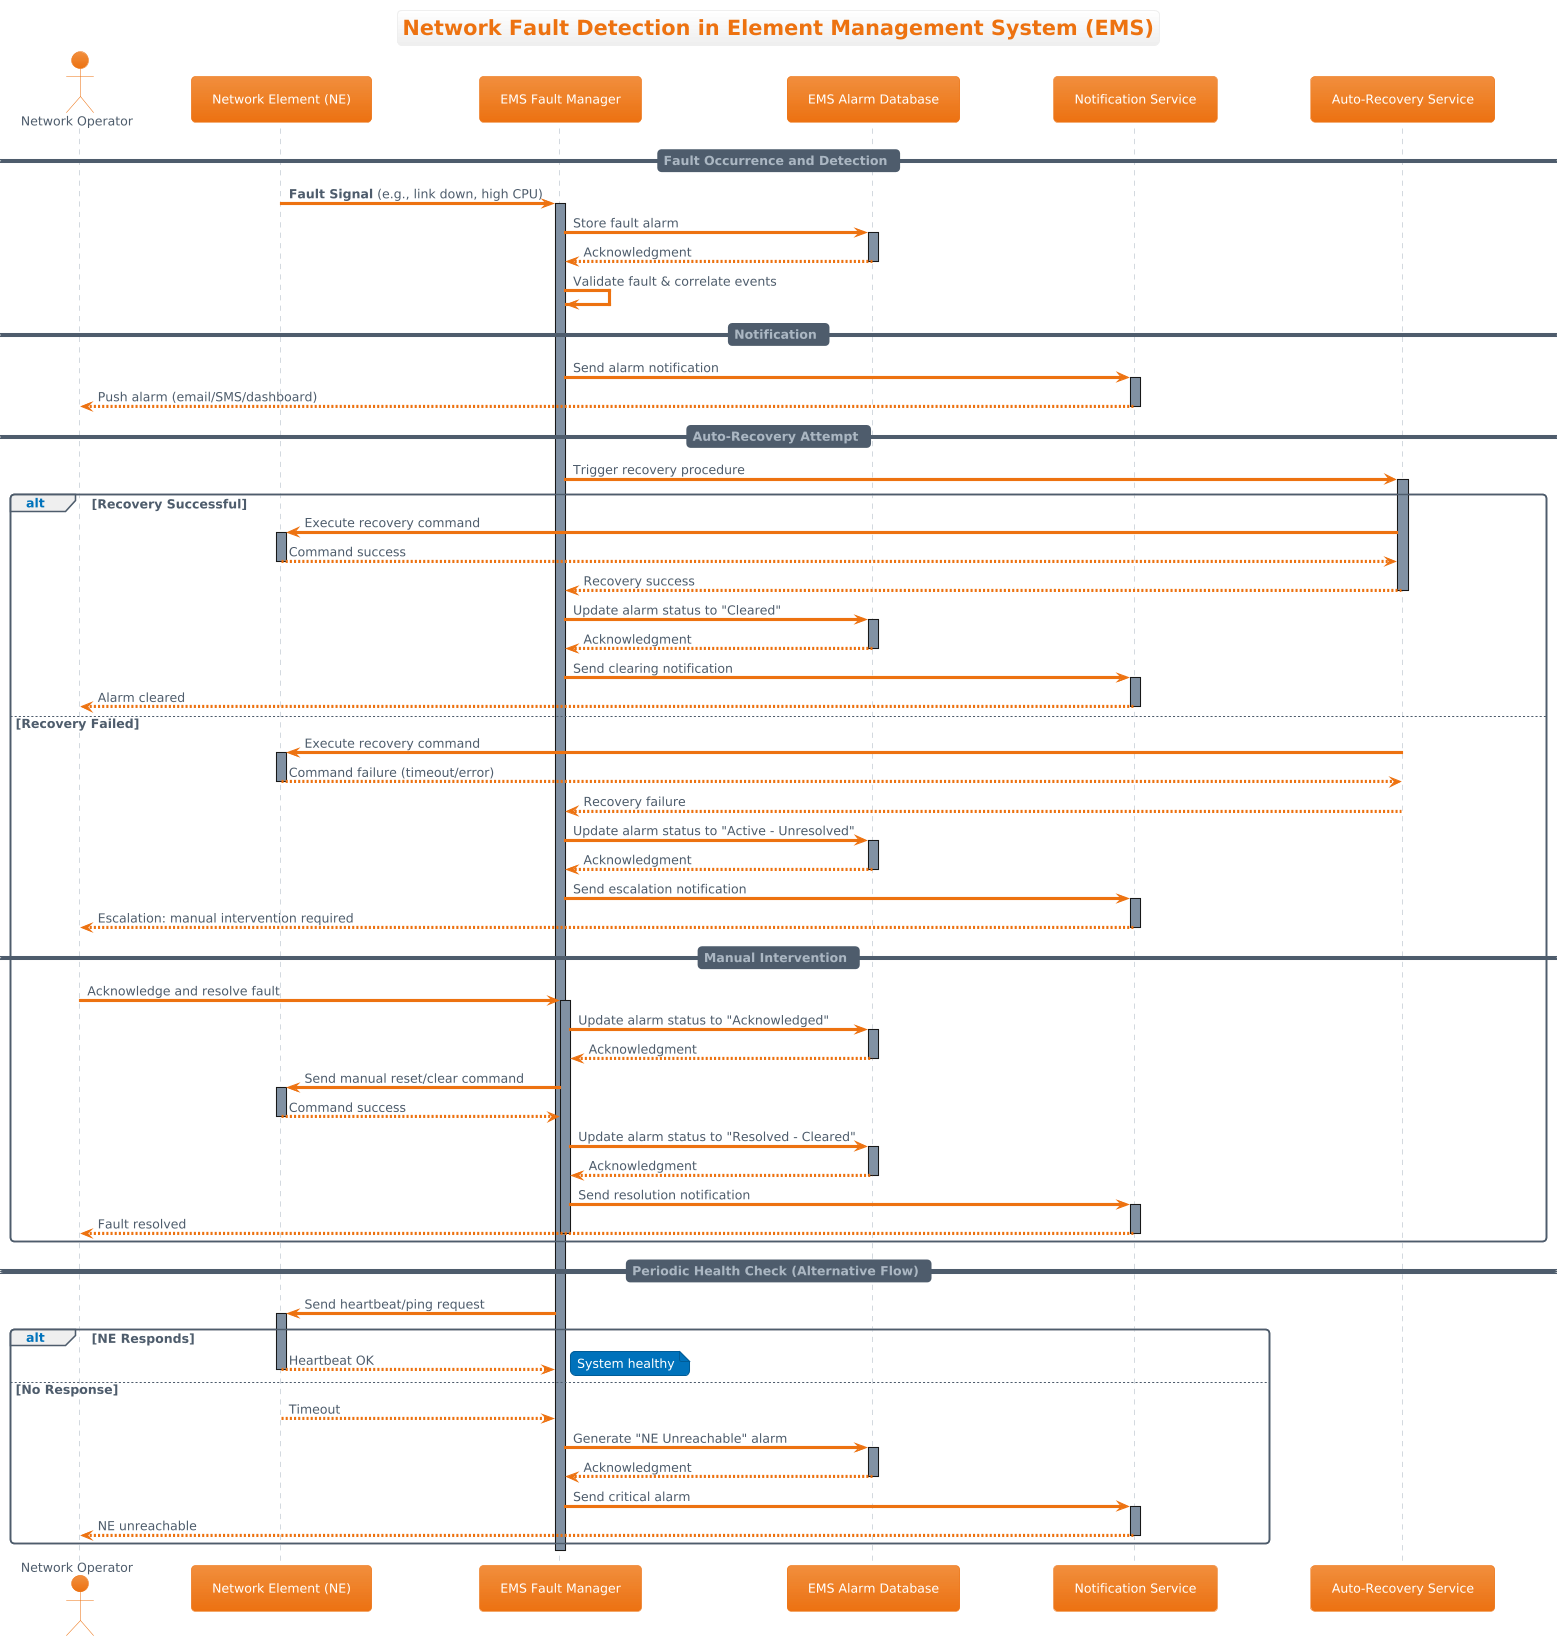
In this specific model, we represent the Element Management System (EMS) as the central orchestrator. The diagram focuses on the interaction between the Network Operator (the human actor), the Network Element (NE) (the physical device), and the internal EMS services like the Fault Manager, Alarm Database, and Notification Service. The activation bars (vertical rectangles) indicate when a participant is actively processing a request, while the horizontal arrows represent messages passed between components.
Target Domain Scope & Scenario
The scope of this diagram is strictly limited to the fault detection and resolution lifecycle. It does not cover general configuration management or performance monitoring, focusing instead on the critical path of fault handling. This includes:
- Initial Detection: How the NE signals the EMS.
- Validation: Correlating events to avoid false positives.
- Recovery Logic: Automated attempts to restore service.
- Escalation: Manual intervention paths when automation fails.
Key Takeaways & Educational Insights
By constructing this diagram, you will gain clarity on the boundary between automated and manual operations. You will learn how to model alternative flows using combined fragments (alt/else blocks), which is essential for documenting error handling. This model serves as a blueprint for developers to implement the corresponding state machines and API endpoints in the actual EMS software.
Complete Diagram & Full Source Code
Below is the finished blueprint for the Network Fault Detection scenario. This diagram utilizes the aws-orange theme for a professional look and includes combined fragments to handle both successful recovery and failure scenarios.
@startuml
!theme aws-orange

title Network Fault Detection in Element Management System (EMS)

/'
This sequence diagram illustrates the network fault detection scenario within an Element Management System (EMS).
It covers the flow from fault occurrence at a network element, through detection by the EMS,
to notification and resolution actions. Alternative flows are included for:
- Successful fault detection and clearing.
- Unsuccessful detection with timeout and retry mechanism.
- Manual intervention for fault acknowledgment and resolution.
'/

actor "Network Operator" as Operator
participant "Network Element (NE)" as NE
participant "EMS Fault Manager" as FM
participant "EMS Alarm Database" as DB
participant "Notification Service" as Notif
participant "Auto-Recovery Service" as AutoRec

== Fault Occurrence and Detection ==
NE -> FM: **Fault Signal** (e.g., link down, high CPU)
activate FM
FM -> DB: Store fault alarm
activate DB
DB --> FM: Acknowledgment
deactivate DB

FM -> FM: Validate fault & correlate events

== Notification ==
FM -> Notif: Send alarm notification
activate Notif
Notif --> Operator: Push alarm (email/SMS/dashboard)
deactivate Notif

== Auto-Recovery Attempt ==
FM -> AutoRec: Trigger recovery procedure
activate AutoRec

alt Recovery Successful
    AutoRec -> NE: Execute recovery command
    activate NE
    NE --> AutoRec: Command success
    deactivate NE
    AutoRec --> FM: Recovery success
    deactivate AutoRec
    FM -> DB: Update alarm status to "Cleared"
    activate DB
    DB --> FM: Acknowledgment
    deactivate DB
    FM -> Notif: Send clearing notification
    activate Notif
    Notif --> Operator: Alarm cleared
    deactivate Notif

else Recovery Failed
    AutoRec -> NE: Execute recovery command
    activate NE
    NE --> AutoRec: Command failure (timeout/error)
    deactivate NE
    AutoRec --> FM: Recovery failure
    deactivate AutoRec
    FM -> DB: Update alarm status to "Active - Unresolved"
    activate DB
    DB --> FM: Acknowledgment
    deactivate DB
    FM -> Notif: Send escalation notification
    activate Notif
    Notif --> Operator: Escalation: manual intervention required
    deactivate Notif

    == Manual Intervention ==
    Operator -> FM: Acknowledge and resolve fault
    activate FM
    FM -> DB: Update alarm status to "Acknowledged"
    activate DB
    DB --> FM: Acknowledgment
    deactivate DB
    FM -> NE: Send manual reset/clear command
    activate NE
    NE --> FM: Command success
    deactivate NE
    FM -> DB: Update alarm status to "Resolved - Cleared"
    activate DB
    DB --> FM: Acknowledgment
    deactivate DB
    FM -> Notif: Send resolution notification
    activate Notif
    Notif --> Operator: Fault resolved
    deactivate Notif
    deactivate FM
end

== Periodic Health Check (Alternative Flow) ==
FM -> NE: Send heartbeat/ping request
activate NE
alt NE Responds
    NE --> FM: Heartbeat OK
    deactivate NE
    note right: System healthy
else No Response
    NE --> FM: Timeout
    deactivate NE
    FM -> DB: Generate "NE Unreachable" alarm
    activate DB
    DB --> FM: Acknowledgment
    deactivate DB
    FM -> Notif: Send critical alarm
    activate Notif
    Notif --> Operator: NE unreachable
    deactivate Notif
end

deactivate FM
@endumlStep-by-Step Architectural Walkthrough
Building a professional sequence diagram requires a structured approach. We will break down the construction into four distinct phases: Canvas Configuration, Entity Declaration, Interaction Mapping, and Visual Polish.
Phase 1: Canvas Configuration & Layout Directives
The first step is setting the global context for the diagram. We define the diagram type and the visual theme to ensure consistency with your organization’s branding. In VPasCode, you can instantly preview these changes.
Begin by declaring the start of the diagram and applying the theme. We use the !theme aws-orange directive to give the diagram a modern, warm color palette suitable for alerting systems.
@startuml
!theme aws-orange

title Network Fault Detection in Element Management System (EMS)
Next, we add a comment block to document the scope of the diagram. This is crucial for maintainability. In PlantUML, comments are enclosed in /' and '/.
/'
This sequence diagram illustrates the network fault detection scenario within an Element Management System (EMS).
It covers the flow from fault occurrence at a network element, through detection by the EMS,
to notification and resolution actions. Alternative flows are included for:
- Successful fault detection and clearing.
- Unsuccessful detection with timeout and retry mechanism.
- Manual intervention for fault acknowledgment and resolution.
'/
Phase 2: Declaring Core Entities, Actors, and Boundaries
Once the canvas is ready, we define the participants. In a sequence diagram, participants are the vertical lines (lifelines) that represent objects, actors, or subsystems. We use the actor keyword for human users and participant for system components.
We assign aliases to these participants to keep the message labels concise. For example, defining "Network Operator" as Operator allows us to refer to it simply as Operator later.
actor "Network Operator" as Operator
participant "Network Element (NE)" as NE
participant "EMS Fault Manager" as FM
participant "EMS Alarm Database" as DB
participant "Notification Service" as Notif
participant "Auto-Recovery Service" as AutoRec
Phase 3: Mapping Data Flows & Key Interactions
This is the core logic of the diagram. We map the chronological flow of events using arrows. A solid arrow (->) represents a synchronous message, while a dashed arrow (-->) represents a return message or asynchronous signal.
We group these interactions into sections using == headers. For example, the == Fault Occurrence and Detection == header visually separates the initial event from the subsequent recovery logic.
== Fault Occurrence and Detection ==
NE -> FM: **Fault Signal** (e.g., link down, high CPU)
activate FM
FM -> DB: Store fault alarm
activate DB
DB --> FM: Acknowledgment
deactivate DB
Notice the use of activate and deactivate. These commands draw the vertical activation bars on the lifelines, indicating when a participant is busy processing a task.
Phase 4: Grouping, Annotations & Visual Polish
Real-world systems are rarely linear; they involve decision points. We use alt and else blocks to represent combined fragments (decision logic). This allows us to show the Recovery Successful path versus the Recovery Failed path within the same diagram.
We also add notes to provide context without cluttering the main flow. The note right command places a sticky note on the right side of a specific lifeline.
alt Recovery Successful
    AutoRec -> NE: Execute recovery command
    activate NE
    NE --> AutoRec: Command success
deactivate NE
else Recovery Failed
    ... (logic for failure)
end
Syntax & Keyword Deep Dive
To fully master this diagram, you need to understand the specific PlantUML syntax features used here.
actor: Declares a human user or external entity. In this diagram, it represents the Network Operator who monitors and intervenes.participant: Declares a system component or service. Used for the Fault Manager, Database, and Network Element.->and-->: Standard message arrows.->is a request,-->is a response. You can use-->*for asynchronous signals.activate/deactivate: Controls the rendering of the activation bar (the thin vertical rectangle) on a lifeline. It visually indicates the duration of a task.alt/else/end: These keywords define a combined fragment.altstarts a conditional block,elsedefines the alternative path, andendcloses the block. This is essential for modeling error handling and retries.note: Adds an annotation to the diagram. You can specify position (e.g.,note right,note left) and link it to a specific participant.title: Sets the main title of the diagram, which appears at the top.!theme: Applies a predefined color scheme.aws-orangeis one of the built-in themes in VPasCode.
Best Practices & Pitfalls to Avoid
When creating sequence diagrams for complex systems like an EMS, adherence to best practices ensures the diagram remains readable and useful.
- Limit Scope per Diagram: Do not try to model the entire lifecycle of the EMS in one diagram. Focus on specific scenarios like Fault Detection, Configuration Update, or Performance Monitoring separately.
- Use Meaningful Aliases: Long participant names can clutter the diagram. Always define an alias (e.g.,
as FM) to keep message labels short and readable. - Manage Visual Complexity: If you have too many
altblocks, the diagram becomes hard to follow. Consider splitting complex logic into multiple diagrams or using State Diagrams for the internal logic of a single service. - Consistent Naming: Use consistent terminology across your diagrams. If you call it Network Element in one diagram, do not switch to NE or Device in another without defining the alias clearly.
Try It Yourself with VPasCode
Start Building PlantUML Sequence Diagrams Faster with VPasCode
Test, preview, and customize this EMS fault detection diagram instantly in your browser with VPasCode, the free diagram-as-code editor.