


In the modern energy sector, the reliability of oil and gas pipeline infrastructure depends heavily on sophisticated telemetry systems. These systems aggregate vast amounts of real-time data from distributed field devices, process it for anomalies, and trigger automated control actions to ensure safety and efficiency. For software architects and domain engineers, visualizing this complex ecosystem requires more than just text documentation; it demands a structured representation of the underlying data model.
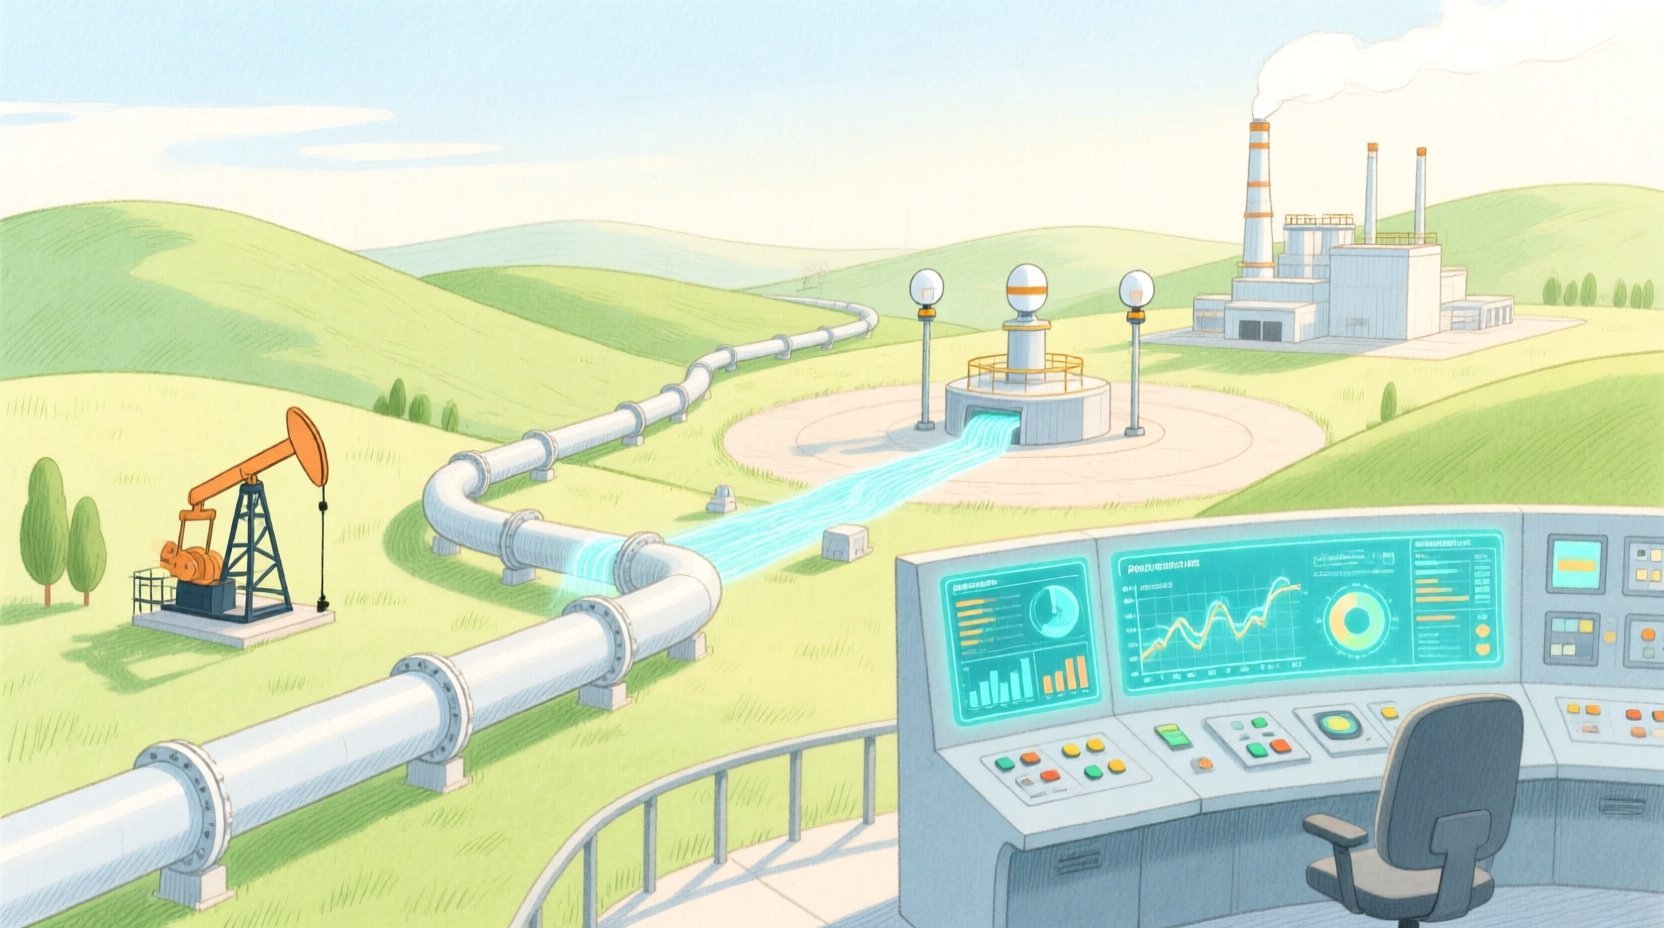
A Class Diagram serves as the blueprint for this system, defining the static structure of the software. It maps physical assets like pipelines and pump stations to their software counterparts, defines the hierarchy of sensors and actuators, and outlines the logic for processing telemetry readings and generating alerts. By using PlantUML within VPasCode, architects can rapidly prototype these models, ensuring that the codebase aligns with the physical reality of the infrastructure.
This tutorial guides you through building a professional Oil and Gas Pipeline Telemetry System class diagram. We will cover domain abstraction, inheritance hierarchies, and relationship cardinalities, providing a reusable pattern for modeling industrial IoT (IIoT) systems.
Understanding the Model: Purpose, Scope & Problem Framing
Diagram Abstraction & Representation
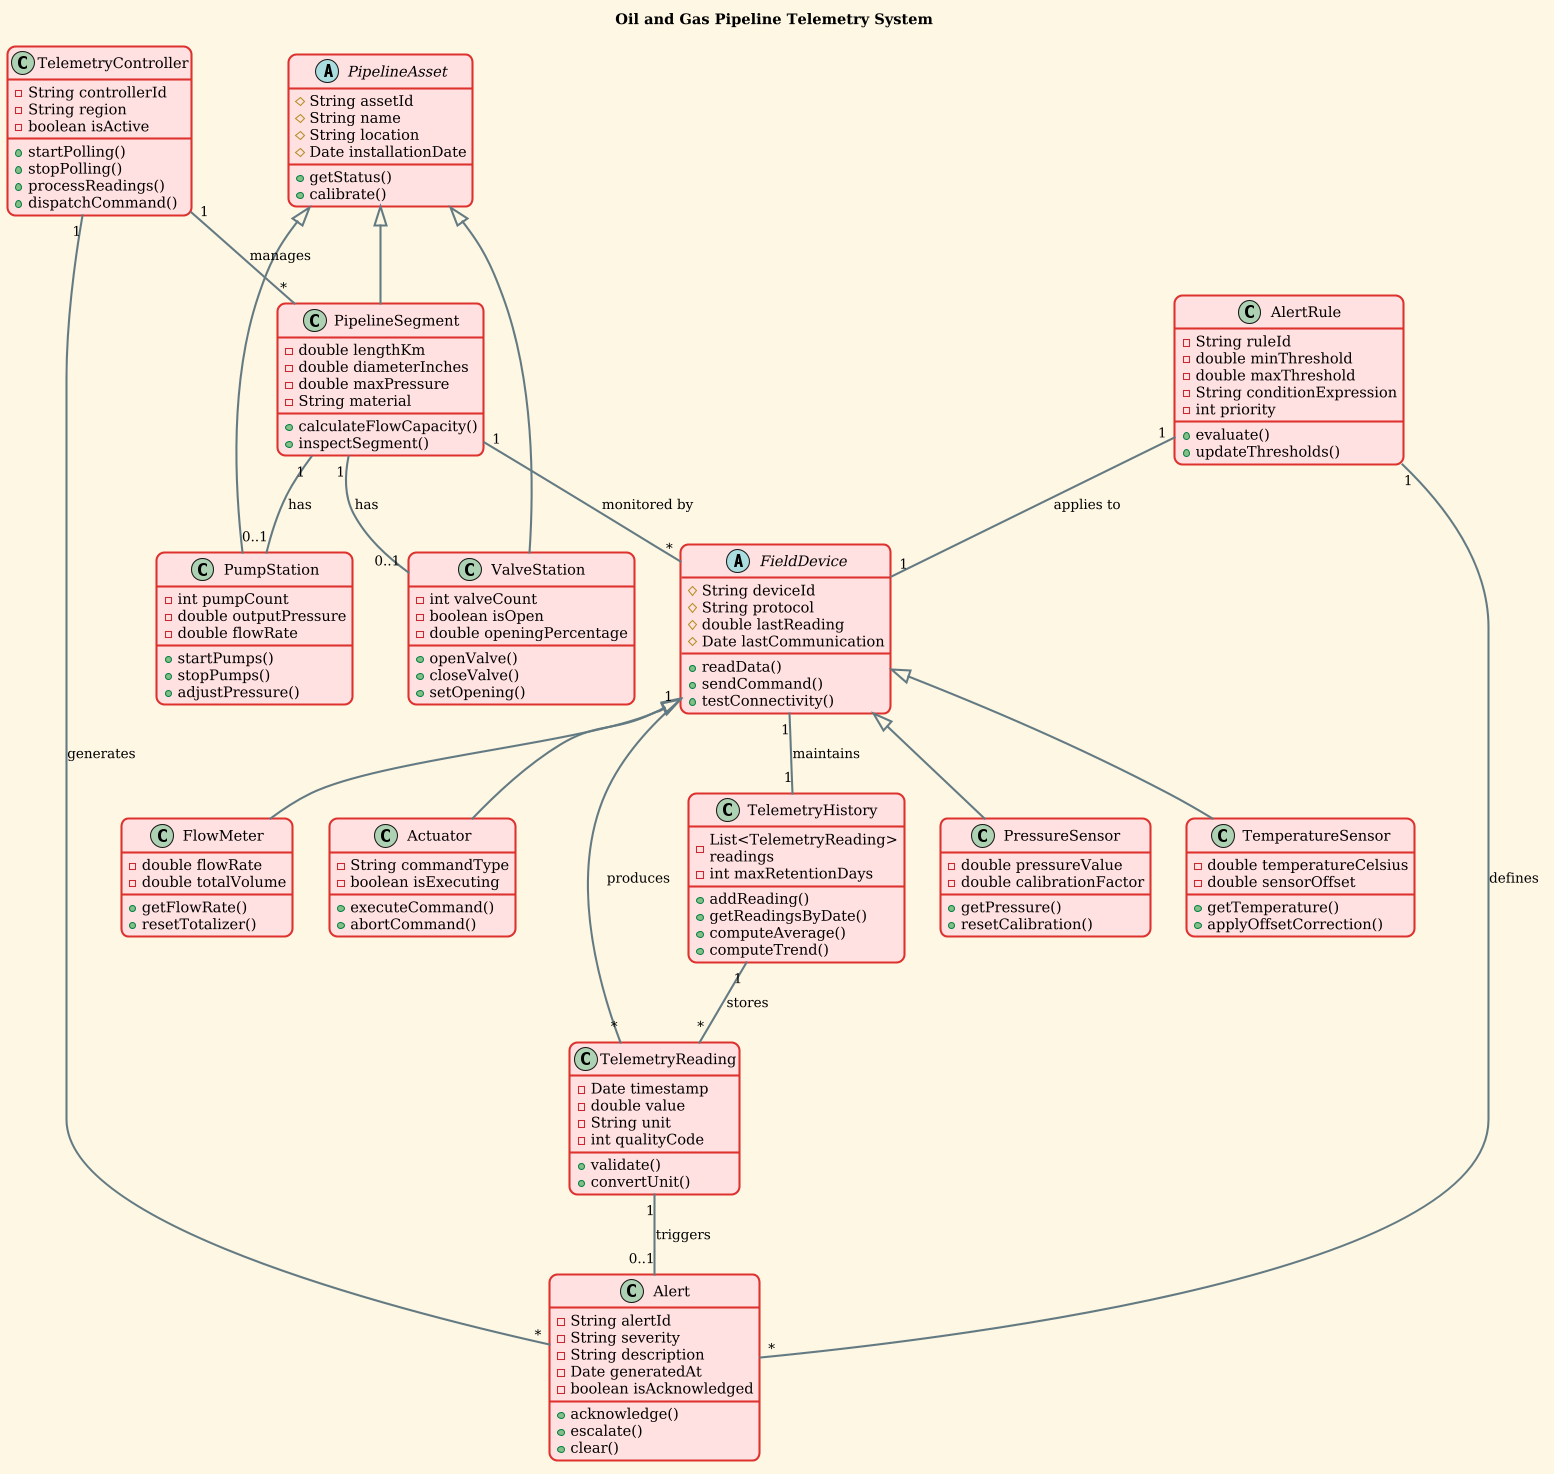
This class diagram models the core domain abstractions for an oil and gas pipeline telemetry system. It is not merely a list of classes; it represents the ubiquitous language of the engineering domain translated into software constructs.
- Physical vs. Logical Mapping: The diagram bridges the gap between physical hardware (e.g., a Pressure Sensor) and logical software objects (e.g., the
PressureSensorclass). This ensures that every physical component has a corresponding digital twin in the control system. - Inheritance Hierarchies: By using abstract classes like
PipelineAssetandFieldDevice, the model enforces a strict taxonomy. This abstraction allows the system to treat diverse devices uniformly when performing operations likegetStatus()orreadData(), promoting code reusability and polymorphism. - Data Flow & Logic: The relationships between
TelemetryReading,Alert, andAlertRulecapture the temporal evolution of data. It defines how raw sensor values transform into actionable business intelligence (alerts) based on configurable thresholds.
Target Domain Scope & Scenario
The scope of this model is focused on the monitoring and control plane of the telemetry system. It intentionally excludes network infrastructure details (like routers or firewalls) and focuses purely on the domain entities that manage the pipeline’s operational state.
The scenario covers:
- Asset Management: Defining the hierarchy of pipelines, pump stations, and valve stations.
- Device Telemetry: Capturing readings from pressure, temperature, and flow sensors.
- Control Logic: Managing alert generation and rule evaluation.
Key Takeaways & Educational Insights
By constructing this model, you will gain insights into:
- How to structure domain-driven design (DDD) models using PlantUML.
- Best practices for defining generalization (inheritance) and aggregation relationships.
- How to document complex industrial systems in a text-based, version-friendly format.
Complete Diagram & Full Source Code
Before diving into the step-by-step construction, review the complete blueprint below. This diagram defines the structure of the Oil and Gas Pipeline Telemetry System, incorporating themes, class definitions, and relationship cardinalities.
@startuml
!theme sunlust

title Oil and Gas Pipeline Telemetry System

/'
This class diagram models the core domain abstractions for an oil and gas pipeline telemetry system.
The system is responsible for real-time monitoring and control of pipeline infrastructure across distributed geographic locations.
It manages sensor data acquisition from physical field devices, processes alert conditions based on configurable thresholds,
and supports remote actuator commands for pressure regulation and emergency shutdown.

The diagram captures the hierarchical structure of physical assets (pipelines, stations, sensors, actuators),
the temporal evolution of telemetry readings, and the decision logic that transforms raw data into actionable alerts.
Key relationships include composition of pipeline segments into a network, aggregation of sensor histories,
and generalization of device types into unified interfaces for data collection and command execution.
'/

class TelemetryController {
  - String controllerId
  - String region
  - boolean isActive
  + startPolling()
  + stopPolling()
  + processReadings()
  + dispatchCommand()
}

abstract class PipelineAsset {
  # String assetId
  # String name
  # String location
  # Date installationDate
  + getStatus()
  + calibrate()
}

class PipelineSegment {
  - double lengthKm
  - double diameterInches
  - double maxPressure
  - String material
  + calculateFlowCapacity()
  + inspectSegment()
}

class PumpStation {
  - int pumpCount
  - double outputPressure
  - double flowRate
  + startPumps()
  + stopPumps()
  + adjustPressure()
}

class ValveStation {
  - int valveCount
  - boolean isOpen
  - double openingPercentage
  + openValve()
  + closeValve()
  + setOpening()
}

abstract class FieldDevice {
  # String deviceId
  # String protocol
  # double lastReading
  # Date lastCommunication
  + readData()
  + sendCommand()
  + testConnectivity()
}

class PressureSensor {
  - double pressureValue
  - double calibrationFactor
  + getPressure()
  + resetCalibration()
}

class TemperatureSensor {
  - double temperatureCelsius
  - double sensorOffset
  + getTemperature()
  + applyOffsetCorrection()
}

class FlowMeter {
  - double flowRate
  - double totalVolume
  + getFlowRate()
  + resetTotalizer()
}

class Actuator {
  - String commandType
  - boolean isExecuting
  + executeCommand()
  + abortCommand()
}

class TelemetryReading {
  - Date timestamp
  - double value
  - String unit
  - int qualityCode
  + validate()
  + convertUnit()
}

class Alert {
  - String alertId
  - String severity
  - String description
  - Date generatedAt
  - boolean isAcknowledged
  + acknowledge()
  + escalate()
  + clear()
}

class AlertRule {
  - String ruleId
  - double minThreshold
  - double maxThreshold
  - String conditionExpression
  - int priority
  + evaluate()
  + updateThresholds()
}

class TelemetryHistory {
  - List<TelemetryReading> readings
  - int maxRetentionDays
  + addReading()
  + getReadingsByDate()
  + computeAverage()
  + computeTrend()
}

' Relationships
PipelineAsset <|-- PipelineSegment
PipelineAsset <|-- PumpStation
PipelineAsset <|-- ValveStation

FieldDevice <|-- PressureSensor
FieldDevice <|-- TemperatureSensor
FieldDevice <|-- FlowMeter
FieldDevice <|-- Actuator

PipelineSegment "1" -- "*" FieldDevice : monitored by
PipelineSegment "1" -- "0..1" PumpStation : has
PipelineSegment "1" -- "0..1" ValveStation : has

TelemetryController "1" -- "*" PipelineSegment : manages
TelemetryController "1" -- "*" Alert : generates

FieldDevice "1" -- "*" TelemetryReading : produces
TelemetryReading "1" -- "0..1" Alert : triggers

AlertRule "1" -- "*" Alert : defines
AlertRule "1" -- "1" FieldDevice : applies to

TelemetryHistory "1" -- "*" TelemetryReading : stores
FieldDevice "1" -- "1" TelemetryHistory : maintains

@endumlStep-by-Step Architectural Walkthrough
Now that you have the full code, let’s deconstruct how to build this diagram systematically. We will follow a logical progression from configuration to entity definition, and finally to relationship mapping.
Phase 1: Canvas Configuration & Layout Directives
Before defining any classes, we must set the stage. In PlantUML, this involves declaring the theme and the diagram title. This ensures the diagram is consistent with your project’s branding and immediately understandable.
First, we apply the !theme sunlust directive. This loads a specific color palette and style definition, giving the diagram a professional, high-contrast look suitable for technical documentation.
!theme sunlust

title Oil and Gas Pipeline Telemetry System
Next, we add a comment block to document the context of the diagram. This is crucial for future maintainers who might not be familiar with the domain immediately.
/'
This class diagram models the core domain abstractions for an oil and gas pipeline telemetry system.
... (additional context) ...
'/
Phase 2: Declaring Core Entities, Actors, and Boundaries
The foundation of the model lies in defining the core classes. We start with the Controller and the Asset Hierarchy. Notice the use of abstract class for PipelineAsset. This signals that no single pipeline asset is instantiated directly; instead, specific types like PipelineSegment or PumpStation are created.
We define the attributes (private fields) and methods (public operations) for each class. For example, TelemetryController handles the high-level orchestration, while PipelineSegment focuses on physical properties.
class TelemetryController {
  - String controllerId
  + startPolling()
}

abstract class PipelineAsset {
  # String assetId
  + getStatus()
}
Phase 3: Mapping Data Flows & Key Interactions
The diagram’s complexity increases when we introduce the Field Devices and their data outputs. We define FieldDevice as another abstract class to unify the interface for all sensors and actuators. Concrete implementations like PressureSensor and FlowMeter inherit from this base.
We also define the data model classes. TelemetryReading captures the time-series data, while Alert and AlertRule represent the logic layer that processes this data.
abstract class FieldDevice {
  # String protocol
  + readData()
}

class TelemetryReading {
  - Date timestamp
  - double value