


In the high-stakes environment of the energy sector, maintaining the integrity of long-distance pipelines is critical. An Oil and Gas Pipeline Telemetry System acts as the central nervous system for these assets, collecting real-time data from remote field installations to monitor pressure, flow rates, and potential leaks. For software architects and system engineers, clearly defining the functional requirements of such a complex system is essential before a single line of code is written.
Visual modeling serves as a bridge between domain experts and technical teams. A Use Case Diagram is particularly valuable in this context because it abstracts complex backend logic into high-level interactions between actors (users and external systems) and the system itself. By utilizing PlantUML within the VPasCode editor, architects can rapidly prototype these diagrams as code, ensuring that the visual representation of requirements is accurate, versionable, and instantly shareable without manual drawing tools.
Understanding the Model: Purpose, Scope & Problem Framing
Before diving into the syntax, it is crucial to understand what this specific diagram models and why it is the right tool for the job.
Diagram Abstraction & Representation
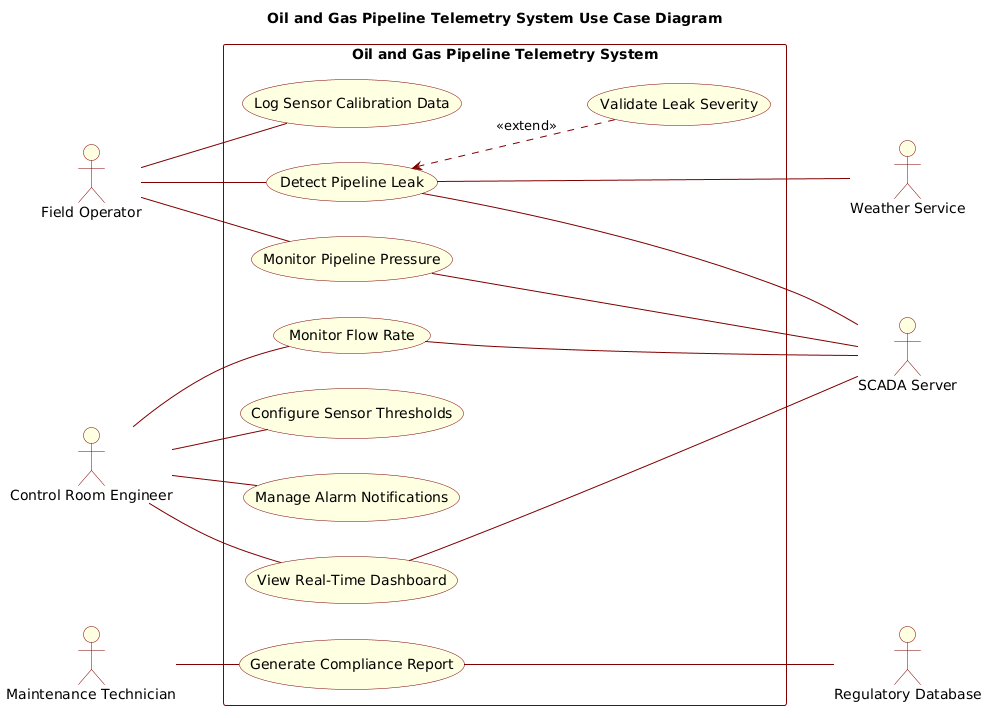
A Use Case Diagram focuses on what the system does from the perspective of its users, not how it does it. In this Oil and Gas Pipeline Telemetry System scenario, the diagram maps the functional boundaries of the software. It identifies:
- Actors: The human roles (Field Operator, Control Room Engineer) and external systems (SCADA Server, Regulatory Database) that interact with the telemetry platform.
- Use Cases: The specific functional goals, such as “Monitor Pipeline Pressure” or “Detect Pipeline Leak.”
- System Boundary: The rectangle that encapsulates the functionality provided by the software, distinguishing internal processes from external entities.
Target Domain Scope & Scenario
This model focuses specifically on the Telemetry System layer of the infrastructure. It deliberately excludes lower-level hardware protocols (like Modbus or OPC-UA) and higher-level business strategy. The scope covers the monitoring, reporting, and maintenance support workflows required to keep the pipeline operational and compliant with regulations.
Key Takeaways & Educational Insights
By constructing this diagram, you will gain clarity on:
- Which actors require direct access to real-time dashboards versus maintenance logs.
- How external dependencies like the SCADA server and Weather Service influence internal use cases.
- The distinction between primary actions (e.g., Monitoring) and optional extensions (e.g., Validating Leak Severity).
Complete Diagram & Full Source Code
Below is the complete blueprint for the Oil and Gas Pipeline Telemetry System Use Case Diagram. You can view the rendered result immediately in the editor below.
@startuml

!include https://static.visual-paradigm.com/web/resources/plantuml-stdlib/themes/rose.puml

title Oil and Gas Pipeline Telemetry System Use Case Diagram

/'
This diagram models the key interactions within an oil and gas pipeline telemetry system.
The system continuously monitors pipeline conditions such as pressure, flow rate, temperature,
and leak detection across remote field installations. Field operators and control room
engineers rely on real-time sensor data to maintain safe and efficient pipeline operations.
Regulatory compliance and equipment maintenance workflows are also supported through
automated reporting and alarm management capabilities.
'/

left to right direction

actor "Field Operator" as FO
actor "Control Room Engineer" as CRE
actor "Maintenance Technician" as MT

actor "SCADA Server" as SCADA
actor "Regulatory Database" as RD
actor "Weather Service" as WS

rectangle "Oil and Gas Pipeline Telemetry System" {

    usecase "Monitor Pipeline Pressure" as UC1
    usecase "Monitor Flow Rate" as UC2
    usecase "Detect Pipeline Leak" as UC3
    usecase "Generate Compliance Report" as UC4
    usecase "Configure Sensor Thresholds" as UC5
    usecase "Manage Alarm Notifications" as UC6
    usecase "View Real-Time Dashboard" as UC7
    usecase "Log Sensor Calibration Data" as UC8
    usecase "Validate Leak Severity" as UC9

}

FO -- UC1
FO -- UC3
FO -- UC8

CRE -- UC2
CRE -- UC5
CRE -- UC6
CRE -- UC7

MT -- UC4

UC1 --- SCADA
UC2 --- SCADA
UC3 --- SCADA
UC7 --- SCADA

UC4 --- RD

UC3 --- WS

UC3 <.. UC9 : <<extend>>

@endumlStep-by-Step Architectural Walkthrough
Now, let’s break down the construction of this diagram into four logical phases. We will build this incrementally to ensure clarity and maintainability.
Phase 1: Canvas Configuration & Layout Directives
Every PlantUML diagram begins with configuration directives that set the visual theme and layout rules. This ensures the diagram looks professional and fits the available space correctly.
First, we include the rose theme to give the diagram a polished, modern look. We then set the diagram title using the title keyword. Finally, we define the layout direction. For this architecture, a left-to-right flow is chosen to represent the logical progression from user input to system processing.
!include https://static.visual-paradigm.com/web/resources/plantuml-stdlib/themes/rose.puml

title Oil and Gas Pipeline Telemetry System Use Case Diagram

left to right direction
Phase 2: Declaring Core Entities, Actors, and Boundaries
Next, we define the participants. In a Use Case Diagram, actors represent external entities. We declare human actors (Field Operator, Control Room Engineer, Maintenance Technician) and external system actors (SCADA Server, Regulatory Database, Weather Service). We use the as keyword to assign short aliases for easier referencing later.
We then define the system boundary using the rectangle keyword. This rectangle encapsulates the internal functionality of the telemetry system.
actor "Field Operator" as FO
actor "Control Room Engineer" as CRE
actor "Maintenance Technician" as MT

rectangle "Oil and Gas Pipeline Telemetry System" {
    // Use cases will go here
}
Phase 3: Mapping Data Flows & Key Interactions
Inside the system boundary, we define the specific functional goals using the usecase keyword. We assign unique identifiers (UC1, UC2, etc.) to each use case to simplify the association lines.
Once defined, we map the relationships using association lines. In PlantUML, a solid line with no arrowheads (--) represents a standard association. We connect the primary actors on the left to their respective use cases, and the secondary actors on the right to the systems they interact with.
usecase "Monitor Pipeline Pressure" as UC1

FO -- UC1
UC1 --- SCADA
Phase 4: Grouping, Annotations & Visual Polish
The final phase involves adding advanced relationships and comments. We add a comment block to describe the diagram context, which helps other developers understand the purpose of the diagram without reading the code. We also implement an extend relationship to show optional behavior. In this scenario, “Validate Leak Severity” is an optional step that extends the primary “Detect Pipeline Leak” use case.
/'
Diagram description goes here
'/

UC3 <.. UC9 : <>
Syntax & Keyword Deep Dive
To master diagram-as-code, you must understand the specific syntax keywords that drive the rendering engine. Here is a breakdown of the critical PlantUML elements used in this tutorial:
actor: Defines an external entity interacting with the system. Can be human or software.usecase: Defines a specific functional goal or action performed by the system.rectangle: Creates a boundary box to group use cases, representing the system boundary.--: Represents a solid association line between an actor and a use case (no arrow).<..>: Represents a directed relationship (dotted line), often used for inheritance or extension.<<extend>>: A stereotype keyword that defines an optional dependency between use cases./' ... '/: The syntax for a block comment in PlantUML, used for documentation.
Best Practices & Pitfalls to Avoid
When building professional diagrams with VPasCode and PlantUML, keep these guidelines in mind to maintain high-quality documentation:
- Keep Boundaries Clear: Ensure the
rectangleboundary strictly separates internal system logic from external actors. If an actor interacts directly with another external system (like SCADA), keep that actor outside the boundary. - Use Meaningful Aliases: Always assign short aliases (e.g.,
as FO) to actors and use cases. This reduces code clutter and makes the association lines much easier to read. - Avoid Over-Engineering: Do not model every single button click as a use case. Focus on high-level goals. For example, “Click Save” is too low-level; “Generate Compliance Report” is the appropriate level.
- Consistent Naming: Use consistent naming conventions for actors and use cases across your entire documentation suite to ensure clarity for all stakeholders.
Start Building PlantUML Diagrams Faster with VPasCode
Test, preview, and customize your Oil and Gas Pipeline Telemetry System diagrams instantly online in VPasCode without installing any tools.