


In the modern logistics and transportation industry, visibility is everything. Fleet managers rely on real-time data to optimize routes, ensure driver safety, and maintain operational efficiency. However, building a robust Fleet Management System (FMS) requires more than just backend code; it demands a clear architectural blueprint of how data flows between hardware, servers, and user interfaces.

A Sequence Diagram is the ideal tool for visualizing these temporal interactions. It maps out the chronological exchange of messages between system components, helping architects identify bottlenecks, error handling paths, and performance requirements before writing a single line of production code. In this masterclass, we will leverage VPasCode, the free web-based diagram-as-code editor, to construct a professional PlantUML sequence diagram that models a real-time fleet vehicle tracking scenario.
By using diagram-as-code with PlantUML, you gain the ability to version your visual documentation alongside your code, automate diagram generation, and instantly preview changes in the browser without complex installation. This tutorial will walk you through designing a system that handles normal GPS updates, signal loss, offline states, and data validation errors.
Understanding the Model: Purpose, Scope & Problem Framing
Diagram Abstraction & Representation
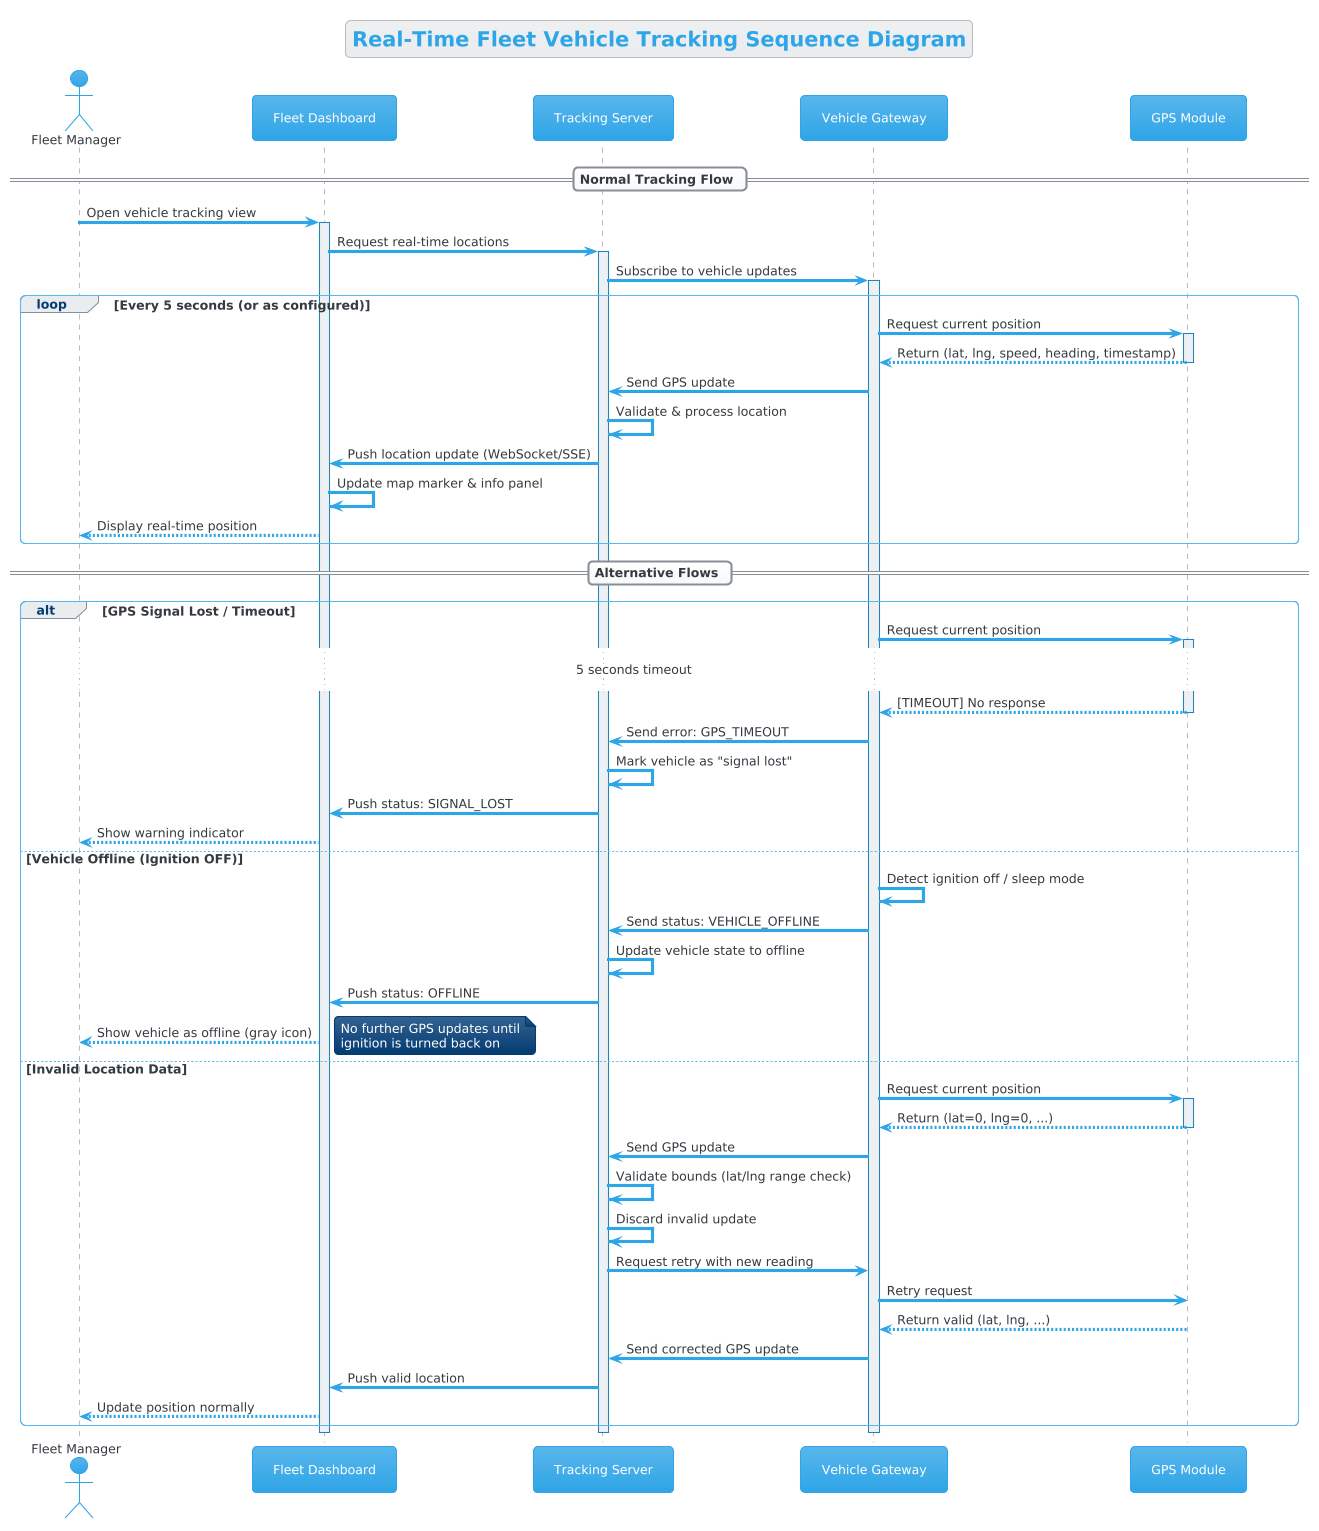
A sequence diagram focuses on behavior over time. In this context, it models the runtime interactions between the Fleet Manager, the Web Dashboard, the Tracking Server, the Vehicle Gateway, and the GPS Module. Unlike a class diagram that defines structure, this diagram answers the question: “What happens when the dashboard requests a vehicle’s location?”
- Lifelines: Represent the participants (e.g.,
Server,Gateway) that maintain state during the interaction. - Messages: Arrows (solid for synchronous, dashed for return) showing the flow of data requests and responses.
- Activation Bars: Rectangles on lifelines indicating when a participant is actively processing a request.
Target Domain Scope & Scenario
This diagram specifically models the Real-Time Tracking Workflow within a logistics ecosystem. The scope is bounded by the moment the Fleet Manager opens the tracking view to the point where the vehicle’s location is updated on the map. It intentionally excludes other flows like maintenance logs or driver shift management to focus purely on telemetry data ingestion and display.
The system handles three critical states:
- Normal Operation: Continuous GPS pings every 5 seconds.
- Signal Loss: Handling timeouts when the GPS module fails to respond.
- Offline Status: Managing vehicles that have turned off their ignition or entered sleep mode.
Key Takeaways & Educational Insights
By the end of this tutorial, you will understand how to model complex conditional logic (using alt and loop fragments), how to represent asynchronous updates (like WebSocket pushes), and how to structure a diagram that clearly communicates error handling strategies to stakeholders.
Complete Diagram & Full Source Code
Below is the finalized blueprint for the Fleet Vehicle Tracking Sequence Diagram. You can view the rendered output immediately by pasting the code into the VPasCode editor.
@startuml
!theme cerulean

title Real-Time Fleet Vehicle Tracking Sequence Diagram

/'
This sequence diagram illustrates the real-time vehicle tracking workflow
within a Fleet Management System. It covers the normal flow where a vehicle
periodically sends GPS updates to the server, which then processes and
forwards the location data to the fleet manager's dashboard.

Alternative flows are included to handle:
1. GPS signal loss / connection timeout.
2. Vehicle going offline (ignition off or system sleep).
3. Invalid or out-of-bounds location data.
'/

actor "Fleet Manager" as FM
participant "Fleet Dashboard" as Dashboard
participant "Tracking Server" as Server
participant "Vehicle Gateway" as Gateway
participant "GPS Module" as GPS

== Normal Tracking Flow ==

FM -> Dashboard: Open vehicle tracking view
activate Dashboard

Dashboard -> Server: Request real-time locations
activate Server

Server -> Gateway: Subscribe to vehicle updates
activate Gateway

loop Every 5 seconds (or as configured)
    Gateway -> GPS: Request current position
    activate GPS
    GPS --> Gateway: Return (lat, lng, speed, heading, timestamp)
    deactivate GPS

    Gateway -> Server: Send GPS update
    Server -> Server: Validate & process location
    Server -> Dashboard: Push location update (WebSocket/SSE)
    Dashboard -> Dashboard: Update map marker & info panel
    Dashboard --> FM: Display real-time position
end

== Alternative Flows ==

alt GPS Signal Lost / Timeout
    Gateway -> GPS: Request current position
    activate GPS
    ... 5 seconds timeout ...
    GPS --> Gateway: [TIMEOUT] No response
    deactivate GPS
    Gateway -> Server: Send error: GPS_TIMEOUT
    Server -> Server: Mark vehicle as "signal lost"
    Server -> Dashboard: Push status: SIGNAL_LOST
    Dashboard --> FM: Show warning indicator

else Vehicle Offline (Ignition OFF)
    Gateway -> Gateway: Detect ignition off / sleep mode
    Gateway -> Server: Send status: VEHICLE_OFFLINE
    Server -> Server: Update vehicle state to offline
    Server -> Dashboard: Push status: OFFLINE
    Dashboard --> FM: Show vehicle as offline (gray icon)
    note right: No further GPS updates until\nignition is turned back on

else Invalid Location Data
    Gateway -> GPS: Request current position
    activate GPS
    GPS --> Gateway: Return (lat=0, lng=0, ...)
    deactivate GPS
    Gateway -> Server: Send GPS update
    Server -> Server: Validate bounds (lat/lng range check)
    Server -> Server: Discard invalid update
    Server -> Gateway: Request retry with new reading
    Gateway -> GPS: Retry request
    GPS --> Gateway: Return valid (lat, lng, ...)
    Gateway -> Server: Send corrected GPS update
    Server -> Dashboard: Push valid location
    Dashboard --> FM: Update position normally
end

deactivate Gateway
deactivate Server
deactivate Dashboard
@endumlStep-by-Step Architectural Walkthrough
Now, let’s break down the construction of this diagram into four logical phases. You can follow these steps in the VPasCode editor to build the diagram from scratch.
Phase 1: Canvas Configuration & Layout Directives
Before defining actors, we set the visual theme and structure. This ensures consistency and adds context to the diagram.
- Theme:
!theme ceruleanapplies a professional blue-toned style suitable for enterprise dashboards. - Title:
title Real-Time Fleet Vehicle Tracking Sequence Diagramprovides immediate context. - Description: The comment block starting with
/'and ending with'/serves as documentation within the code, explaining the alternative flows to future maintainers.
Phase 2: Declaring Core Entities, Actors, and Boundaries
We define the participants using PlantUML’s specific keywords. This establishes the boundaries of our system.
Start by declaring the human actor and the system components:
actor "Fleet Manager" as FM
participant "Fleet Dashboard" as Dashboard
participant "Tracking Server" as Server
participant "Vehicle Gateway" as Gateway
participant "GPS Module" as GPS
Here, we use actor for the external user and participant for system services. We assign short aliases (e.g., FM, Server) to keep message labels concise later.
Phase 3: Mapping Data Flows & Key Interactions
This is the core logic of the diagram. We use the == Section Title == syntax to group flows logically.
For the Normal Tracking Flow, we use a loop fragment to represent the periodic nature of GPS pinging:
loop Every 5 seconds (or as configured)
    Gateway -> GPS: Request current position
    activate GPS
    GPS --> Gateway: Return (lat, lng, speed, heading, timestamp)
    deactivate GPS
    ...
end
The activate and deactivate keywords create the vertical bars on the lifelines, visually indicating when a component is busy processing.
Phase 4: Grouping, Annotations & Visual Polish
Real-world systems must handle errors. We use the alt (alternative) fragment to branch the logic based on specific conditions.
alt GPS Signal Lost / Timeout
    ...
else Vehicle Offline (Ignition OFF)
    ...
else Invalid Location Data
    ...
end
Inside these branches, we model the error paths, such as sending a GPS_TIMEOUT error message or marking the vehicle as OFFLINE. Finally, we add a note to highlight critical business rules, such as no updates occurring until ignition is restored.
Syntax & Keyword Deep Dive
To master PlantUML in VPasCode, you need to understand the specific syntax features used in this fleet tracking diagram.
->(Synchronous Message): Used for requests where the sender waits for a response (e.g.,Gateway -> GPS: Request current position).-->(Asynchronous Return): Used for responses or data pushes (e.g.,Server -> Dashboard: Push location update).activate/deactivate: These keywords draw the activation bars on the lifeline, showing the duration of an operation.loop…end: Defines a repeating block of interactions, essential for modeling periodic telemetry or polling.alt…else…end: Creates a branching path based on conditions, ideal for handling error states or different operational modes.note right/left: Adds contextual annotations to specific lifelines or messages without cluttering the main flow.
Best Practices & Pitfalls to Avoid
When building sequence diagrams for complex logistics systems, keep these guidelines in mind to ensure clarity and maintainability.
- Keep Diagrams Modular: Do not try to model the entire Fleet Management System in one diagram. Focus on specific workflows like “Real-Time Tracking” or “Trip Logging” separately.
- Use Meaningful Message Names: Instead of
A -> B: Send data, useGateway -> Server: Send GPS update. Specificity reduces ambiguity. - Balance Detail and Abstraction: Don’t show every database query. Focus on the high-level API calls and data exchanges between services.
- Document Error Paths: In logistics, signal loss is common. Always model the
altblocks for timeouts and offline states to ensure stakeholders understand how the system degrades gracefully.
Try It Yourself with VPasCode
Start Building Sequence Diagrams Faster with VPasCode
Design and prototype your logistics workflows instantly in the browser with our free PlantUML editor. No installation required.