


In the high-stakes world of financial technology, clarity is not just a design preference—it is a compliance necessity. When building a Trading Platform, architects must visualize the precise sequence of events that occur from the moment a Trader places a buy order to the final settlement at the Clearing House. Unlike static documentation, a sequence diagram captures the temporal flow of interactions between system components, making it the ideal tool for validating critical financial workflows.
This tutorial utilizes VPasCode, a free web-based diagram-as-code editor, to build a robust PlantUML sequence diagram. By adopting a diagram-as-code approach, finance architects can maintain living documentation that evolves alongside the codebase. Using VPasCode eliminates the need for local Java installations or complex CLI setups, allowing you to prototype, render, and refine complex financial logic directly in your browser.
Understanding the Model: Purpose, Scope & Problem Framing
Diagram Abstraction & Representation
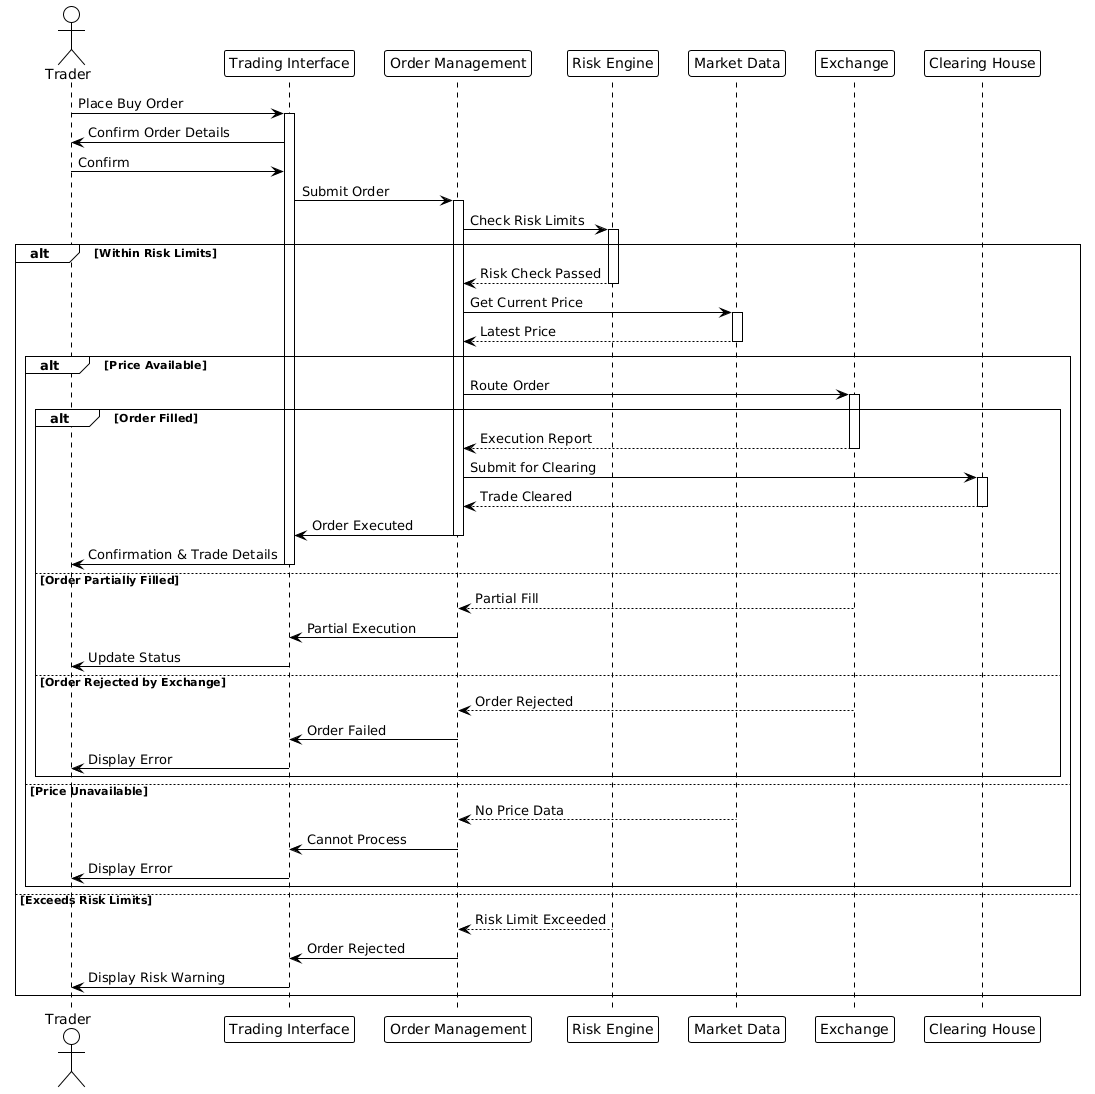
A Sequence Diagram is a time-based interaction model. In this context, it maps the chronological exchange of messages between participants. The vertical axis represents time, flowing downwards, while the horizontal axis represents the spatial arrangement of system components. For a Trading Platform, this diagram is critical because it exposes the dependencies between risk management, market data feeds, and execution engines.
Target Domain Scope & Scenario
This model focuses on the Stock Buy Order Lifecycle. The scope is bounded by the Trader initiating the request and the system providing a final confirmation or error state. It explicitly models the Order Management System as the central orchestrator, interacting with external entities like the Exchange and Clearing House, as well as internal services like the Risk Engine.
Key Takeaways & Educational Insights
By constructing this model, you will gain:
- Boundary Clarity: Understanding where the Trading Platform ends and external systems begin.
- Error Handling Visibility: Seeing how alternative flows (e.g., risk limit exceeded) are handled alongside success paths.
- Lifecycle Management: Observing object activation and deactivation to ensure resources are managed efficiently during the transaction.
Complete Diagram & Full Source Code
Below is the finalized blueprint for the Stock Buy Order workflow. You can view the rendered result immediately using the interactive code block below.
@startuml
!theme plain

actor Trader
participant "Trading Interface" as Interface
participant "Order Management" as OrderMgr
participant "Risk Engine" as RiskEngine
participant "Market Data" as MarketData
participant "Exchange" as Exchange
participant "Clearing House" as ClearingHouse

Trader -> Interface: Place Buy Order
activate Interface
Interface -> Trader: Confirm Order Details
Trader -> Interface: Confirm
Interface -> OrderMgr: Submit Order
activate OrderMgr

OrderMgr -> RiskEngine: Check Risk Limits
activate RiskEngine

alt Within Risk Limits
    RiskEngine --> OrderMgr: Risk Check Passed
    deactivate RiskEngine

    OrderMgr -> MarketData: Get Current Price
    activate MarketData
    MarketData --> OrderMgr: Latest Price
    deactivate MarketData

    alt Price Available
        OrderMgr -> Exchange: Route Order
        activate Exchange

        alt Order Filled
            Exchange --> OrderMgr: Execution Report
            deactivate Exchange

            OrderMgr -> ClearingHouse: Submit for Clearing
            activate ClearingHouse
            ClearingHouse --> OrderMgr: Trade Cleared
            deactivate ClearingHouse

            OrderMgr -> Interface: Order Executed
            deactivate OrderMgr
            Interface -> Trader: Confirmation & Trade Details
            deactivate Interface
        else Order Partially Filled
            Exchange --> OrderMgr: Partial Fill
            deactivate Exchange
            OrderMgr -> Interface: Partial Execution
            deactivate OrderMgr
            Interface -> Trader: Update Status
            deactivate Interface
        else Order Rejected by Exchange
            Exchange --> OrderMgr: Order Rejected
            deactivate Exchange
            OrderMgr -> Interface: Order Failed
            deactivate OrderMgr
            Interface -> Trader: Display Error
            deactivate Interface
        end
    else Price Unavailable
        MarketData --> OrderMgr: No Price Data
        deactivate MarketData
        OrderMgr -> Interface: Cannot Process
        deactivate OrderMgr
        Interface -> Trader: Display Error
        deactivate Interface
    end
else Exceeds Risk Limits
    RiskEngine --> OrderMgr: Risk Limit Exceeded
    deactivate RiskEngine
    OrderMgr -> Interface: Order Rejected
    deactivate OrderMgr
    Interface -> Trader: Display Risk Warning
    deactivate Interface
end
@endumlStep-by-Step Architectural Walkthrough
Building a complex financial sequence diagram requires a structured approach. We will break this construction into four distinct phases to ensure logical flow and accurate syntax.
Phase 1: Canvas Configuration & Layout Directives
Every PlantUML diagram begins with initialization directives. Here, we define the theme and the primary actors.
@startuml: Marks the beginning of the diagram definition.!theme plain: Applies a clean, minimalistic visual style suitable for professional documentation.actor Trader: Defines the human initiator of the workflow.
@startuml
!theme plain

actor Trader
Phase 2: Declaring Core Entities, Actors, and Boundaries
Next, we define the system components. In PlantUML, we use participant for system objects and actor for external users. We can assign aliases (e.g., as OrderMgr) to keep subsequent message references concise.
participant "Trading Interface" as Interface
participant "Order Management" as OrderMgr
participant "Risk Engine" as RiskEngine
participant "Market Data" as MarketData
participant "Exchange" as Exchange
participant "Clearing House" as ClearingHouse
Phase 3: Mapping Data Flows & Key Interactions
The core logic is defined using message arrows. We use -> for synchronous requests and --> for responses. Activation boxes (activate / deactivate) indicate when a participant is busy processing.
Trader -> Interface: Place Buy Order
activate Interface
Interface -> Trader: Confirm Order Details
Trader -> Interface: Confirm
Interface -> OrderMgr: Submit Order
activate OrderMgr
Phase 4: Grouping, Annotations & Visual Polish
Financial workflows are rarely linear. We use alt blocks to model conditional logic, such as risk checks or exchange status. This ensures the diagram accurately reflects real-world failure states.
alt Within Risk Limits
    RiskEngine --> OrderMgr: Risk Check Passed
    deactivate RiskEngine

    OrderMgr -> MarketData: Get Current Price
    activate MarketData
    MarketData --> OrderMgr: Latest Price
    deactivate MarketData

    alt Price Available
        OrderMgr -> Exchange: Route Order
        activate Exchange
        ...
        end
    end
else Exceeds Risk Limits
    RiskEngine --> OrderMgr: Risk Limit Exceeded
    deactivate RiskEngine
    ...
end
Syntax & Keyword Deep Dive
Understanding the specific PlantUML keywords used in this finance diagram is essential for extending the model.
actor: Defines an external user or system that initiates the interaction (e.g., the Trader).participant: Represents a software component, service, or database within the system boundary.->vs-->: Solid arrows (->) denote synchronous calls where the sender waits for a response. Dashed arrows (-->) denote return messages or asynchronous responses.activate/deactivate: These control the vertical activation bar on the lifeline.activatestarts the bar when the participant begins processing, anddeactivateends it, visually indicating processing duration.alt/else/end: These keywords create combined fragments.altdefines a conditional block (e.g., “If Risk Check Passes”), whileelsedefines the alternative path (e.g., “If Risk Check Fails”).!theme plain: A directive that applies a specific visual skin to the entire diagram, ensuring consistent styling across all diagrams in your VPasCode project.
Best Practices & Pitfalls to Avoid
- Maintain Abstraction Levels: Do not mix high-level business flows with low-level database queries. Keep the sequence diagram focused on the orchestration logic between services, not internal implementation details.
- Manage Visual Complexity: Deeply nested
altblocks can make diagrams hard to read. If a workflow has too many branches, consider splitting it into multiple diagrams (e.g., one for “Successful Execution” and one for “Error Handling”). - Use Meaningful Aliases: Always assign short aliases to long participant names (e.g.,
as OrderMgr). This keeps the message lines readable and prevents the diagram from becoming cluttered with text. - Consistent Naming Conventions: Ensure that participant names in the diagram match the actual service names in your codebase to avoid confusion during code reviews.
Try It Yourself with VPasCode
Start Building Sequence Diagrams Faster with VPasCode
Instantly render and customize your financial workflow diagrams online with VPasCode, the free PlantUML editor for architects.