


In the rapidly evolving landscape of energy infrastructure, Smart Grids are the backbone of modern power distribution. They enable two-way communication between utilities and consumers, facilitating critical processes like Demand Response (DR). DR programs allow grid operators to manage energy consumption during peak times, ensuring stability and efficiency. However, modeling these complex interactions requires precision.
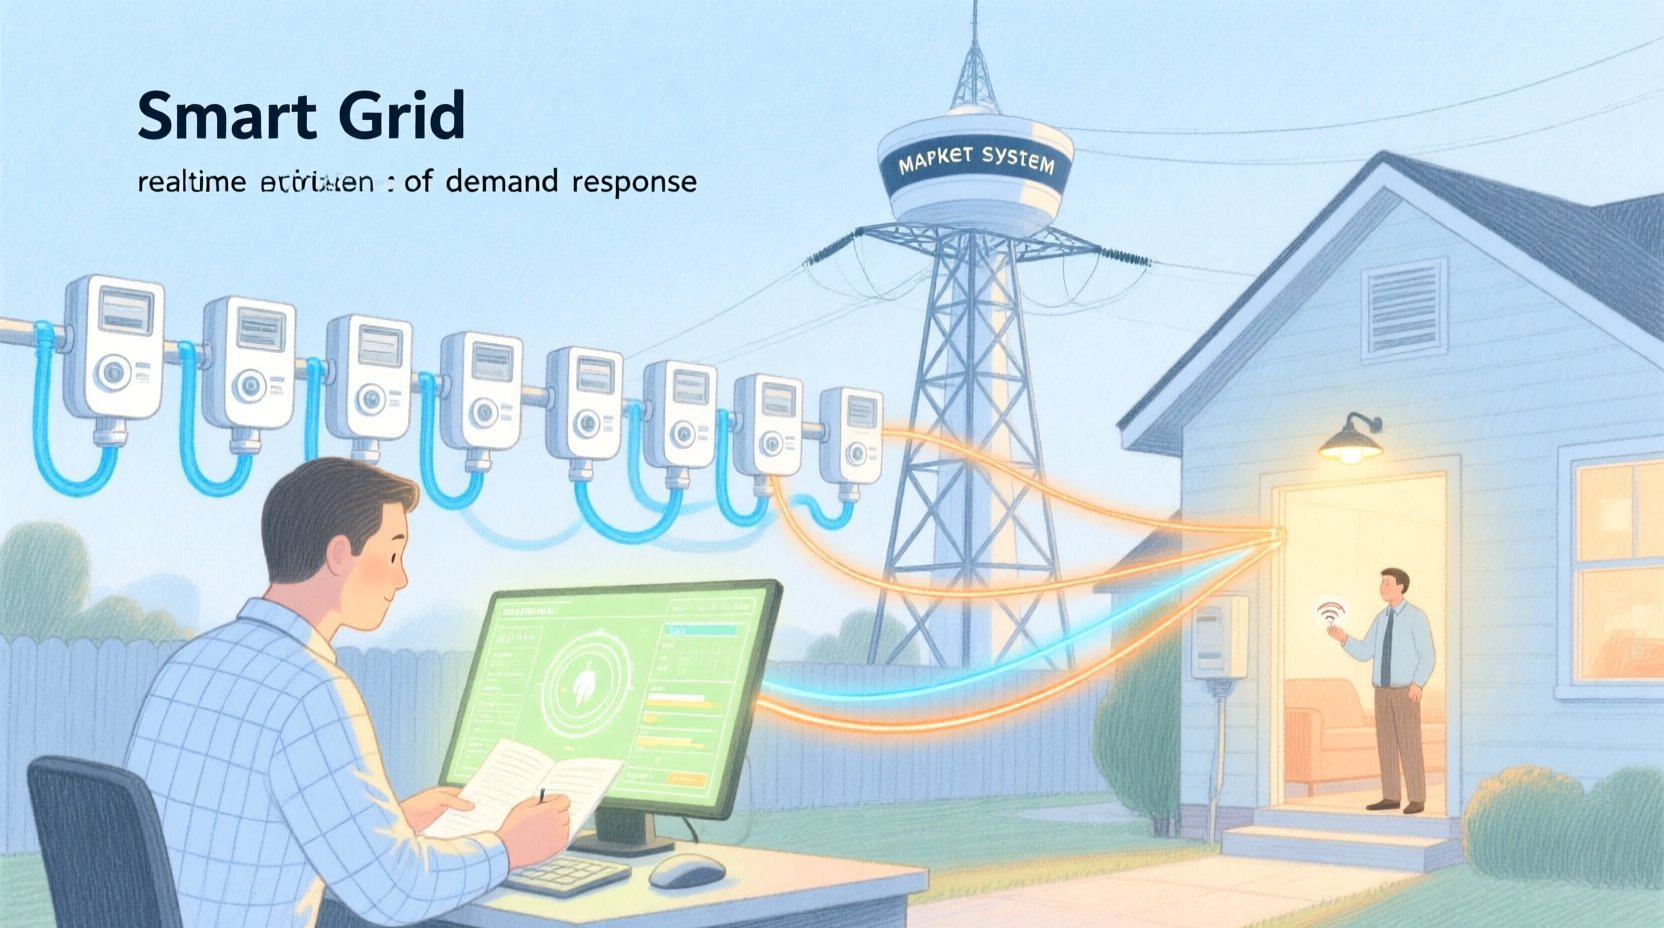
Visualizing the sequence of events between Grid Operators, Market Systems, and Smart Meters is essential for system architects and developers. A Sequence Diagram provides a time-ordered view of these interactions, clarifying how load curtailment is negotiated, executed, and verified. By using VPasCode, the free web-based diagram-as-code editor, engineers can prototype these workflows instantly without installing local dependencies.
This tutorial demonstrates how to construct a professional Demand Response Execution sequence diagram using PlantUML. We will explore the full lifecycle of a DR event, from initial detection to final settlement, utilizing advanced syntax like combined fragments and notes to capture the nuance of energy market logic.
Understanding the Model: Purpose, Scope & Problem Framing
Diagram Abstraction & Representation
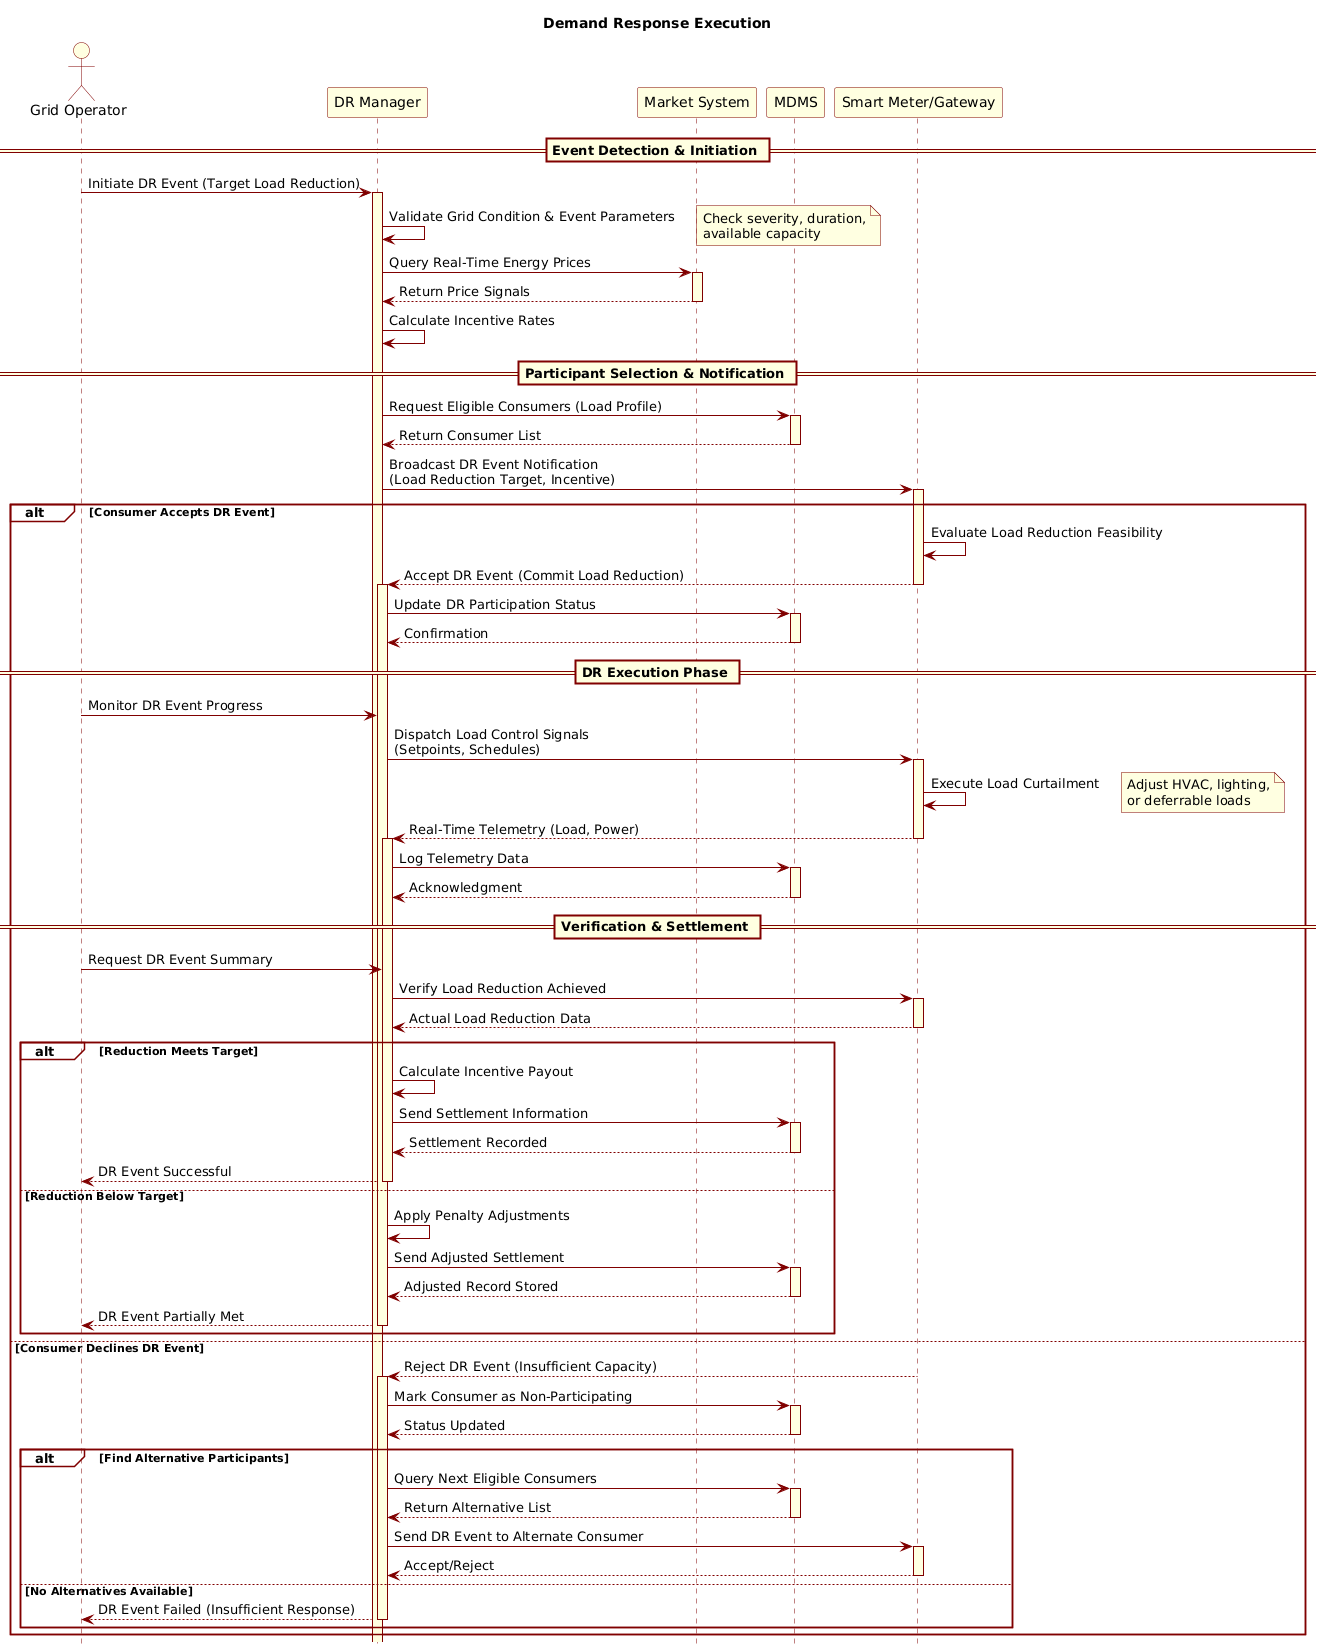
A Sequence Diagram is the ideal tool for modeling the temporal flow of a Demand Response event. Unlike static architecture diagrams, this notation captures the when and how of system communication. In this context, it models the lifecycle of a grid stress event:
- Lifelines: Represent the active participants (Grid Operator, DR Manager, Smart Meter) throughout the timeline.
- Messages: Show synchronous requests (e.g., “Initiate DR Event”) and asynchronous responses (e.g., “Return Price Signals”).
- Activation Bars: Indicate periods where a participant is actively processing logic.
Target Domain Scope & Scenario
This diagram focuses specifically on the Execution Phase of a Smart Grid Monitoring System. It excludes the long-term planning or billing settlement modules, focusing instead on the real-time operational loop. The scope includes:
- Event Detection: The Grid Operator identifies a need for load reduction.
- Negotiation: The DR Manager queries market prices and consumer eligibility.
- Execution: Smart Meters adjust loads (HVAC, lighting) based on signals.
- Verification: Confirming that the target reduction was met before settlement.
Key Takeaways & Educational Insights
By building this model, readers will gain clarity on how distributed energy resources communicate with central control systems. You will learn how to handle alternative flows (e.g., a consumer rejecting a request) and how to structure complex nested logic using PlantUML combined fragments.
Complete Diagram & Full Source Code
Below is the finished blueprint for the Demand Response Execution scenario. You can view the rendered output directly in the VPasCode editor.
@startuml
!include https://static.visual-paradigm.com/web/resources/plantuml-stdlib/themes/rose.puml

title Demand Response Execution

/'
    Description:
    This sequence diagram illustrates the demand response execution scenario
    in a Smart Grid Monitoring System. It shows the interaction between
    the Grid Operator, Demand Response (DR) Manager, Market System,
    Meter Data Management System (MDMS), and the Smart Meter/Home Gateway.
    The flow covers event detection, load curtailment negotiation,
    execution, and verification with alternative paths for acceptance
    and rejection of the DR event.
'/

actor "Grid Operator" as GO
participant "DR Manager" as DRM
participant "Market System" as MS
participant "MDMS" as MDMS
participant "Smart Meter/Gateway" as SM

== Event Detection & Initiation ==

GO -> DRM: Initiate DR Event (Target Load Reduction)
activate DRM

DRM -> DRM: Validate Grid Condition & Event Parameters
note right: Check severity, duration,\navailable capacity

DRM -> MS: Query Real-Time Energy Prices
activate MS
MS --> DRM: Return Price Signals
deactivate MS

DRM -> DRM: Calculate Incentive Rates

== Participant Selection & Notification ==

DRM -> MDMS: Request Eligible Consumers (Load Profile)
activate MDMS
MDMS --> DRM: Return Consumer List
deactivate MDMS

DRM -> SM: Broadcast DR Event Notification\n(Load Reduction Target, Incentive)
activate SM

alt Consumer Accepts DR Event

    SM -> SM: Evaluate Load Reduction Feasibility
    SM --> DRM: Accept DR Event (Commit Load Reduction)
    deactivate SM
    activate DRM

    DRM -> MDMS: Update DR Participation Status
    activate MDMS
    MDMS --> DRM: Confirmation
    deactivate MDMS

    == DR Execution Phase ==

    GO -> DRM: Monitor DR Event Progress
    DRM -> SM: Dispatch Load Control Signals\n(Setpoints, Schedules)
    activate SM

    SM -> SM: Execute Load Curtailment
    note right: Adjust HVAC, lighting,\nor deferrable loads

    SM --> DRM: Real-Time Telemetry (Load, Power)
    deactivate SM
    activate DRM

    DRM -> MDMS: Log Telemetry Data
    activate MDMS
    MDMS --> DRM: Acknowledgment
    deactivate MDMS

    == Verification & Settlement ==

    GO -> DRM: Request DR Event Summary
    DRM -> SM: Verify Load Reduction Achieved
    activate SM
    SM --> DRM: Actual Load Reduction Data
    deactivate SM

    alt Reduction Meets Target

        DRM -> DRM: Calculate Incentive Payout
        DRM -> MDMS: Send Settlement Information
        activate MDMS
        MDMS --> DRM: Settlement Recorded
        deactivate MDMS

        DRM --> GO: DR Event Successful
        deactivate DRM

    else Reduction Below Target

        DRM -> DRM: Apply Penalty Adjustments
        DRM -> MDMS: Send Adjusted Settlement
        activate MDMS
        MDMS --> DRM: Adjusted Record Stored
        deactivate MDMS

        DRM --> GO: DR Event Partially Met
        deactivate DRM

    end

else Consumer Declines DR Event

    SM --> DRM: Reject DR Event (Insufficient Capacity)
    deactivate SM
    activate DRM

    DRM -> MDMS: Mark Consumer as Non-Participating
    activate MDMS
    MDMS --> DRM: Status Updated
    deactivate MDMS

    alt Find Alternative Participants

        DRM -> MDMS: Query Next Eligible Consumers
        activate MDMS
        MDMS --> DRM: Return Alternative List
        deactivate MDMS

        DRM -> SM: Send DR Event to Alternate Consumer
        activate SM
        SM --> DRM: Accept/Reject
        deactivate SM

    else No Alternatives Available

        DRM --> GO: DR Event Failed (Insufficient Response)
        deactivate DRM

    end

end
@endumlStep-by-Step Architectural Walkthrough
Phase 1: Canvas Configuration & Layout Directives
Before defining actors, we set the visual theme and title to ensure the diagram aligns with professional documentation standards. We include the PlantUML Rose theme to provide a consistent color palette and styling.
!include https://static.visual-paradigm.com/web/resources/plantuml-stdlib/themes/rose.puml

title Demand Response Execution

/'
    Description:
    This sequence diagram illustrates...
'/
The title directive adds a header, while the comment block (starting with /' and ending with '/) provides metadata that is visible in the rendered diagram but not part of the logic.
Phase 2: Declaring Core Entities, Actors, and Boundaries
Next, we define the participants in the Smart Grid ecosystem. Using PlantUML, we distinguish between external actors (human operators) and internal system components (software services).
actor "Grid Operator" as GO
participant "DR Manager" as DRM
participant "Market System" as MS
participant "MDMS" as MDMS
participant "Smart Meter/Gateway" as SM
Here, actor is used for the human role, while participant represents system interfaces. We assign aliases (e.g., as GO) to keep subsequent message references concise.
Phase 3: Mapping Data Flows & Key Interactions
We now establish the chronological flow of the DR event. Messages are represented by arrows. Solid arrows (->) indicate synchronous calls, while dashed arrows (-->) indicate return messages.
GO -> DRM: Initiate DR Event (Target Load Reduction)
activate DRM

DRM -> MS: Query Real-Time Energy Prices
activate MS
MS --> DRM: Return Price Signals
deactivate MS
The activate and deactivate keywords create vertical bars on the lifelines, visually indicating when a participant is busy processing a request.
Phase 4: Grouping, Annotations & Visual Polish
Complex logic, such as accepting or rejecting a DR event, is handled using combined fragments. The alt block allows us to model branching paths within the same timeline.
alt Consumer Accepts DR Event
    SM -> SM: Evaluate Load Reduction Feasibility
    ...
else Consumer Declines DR Event
    SM --> DRM: Reject DR Event
end
Notes are added using the note keyword to provide context without cluttering the message flow, such as checking severity or adjusting HVAC loads.
Syntax & Keyword Deep Dive
To customize this diagram further, it is essential to understand the specific PlantUML syntax features used in this model:
actor: Defines a human or external entity interacting with the system.participant: Defines a system component, service, or database.->vs-->:->is a standard request (synchronous), while-->is a return message (asynchronous).activate/deactivate: Controls the visibility of the activation bar on a lifeline.alt/else/end: Creates a combined fragment to represent alternative execution paths (e.g., Accept vs. Reject).note: Adds explanatory text attached to a specific lifeline or message.title: Sets the main heading for the diagram.
Best Practices & Pitfalls to Avoid
- Keep Diagrams Modular: Avoid creating a single massive sequence diagram. If the logic becomes too complex, consider splitting it into separate diagrams (e.g., one for “Initiation” and one for “Settlement”).
- Use Clear Naming Conventions: Always define aliases (e.g.,
as GO) for long participant names to prevent the diagram from becoming cluttered with text. - Manage Visual Complexity: Use
altblocks sparingly. Too many nested alternatives can make the timeline hard to read. Consider simplifying by removing less critical error paths if the goal is high-level overview. - Leverage Themes: Always include a theme (like
rose.puml) to ensure your diagrams look professional and consistent with your organization’s branding.
Try It Yourself with VPasCode
Start Building PlantUML Sequence Diagrams Faster with VPasCode
Instantly render, test, and customize your Smart Grid diagrams online in VPasCode without installing any tools.