


在追踪每日习惯、网站流量、服务器活动日志或全年日历周期内的销售强度时,日历图提供了一种高效且基于网格的可视化布局。日历图以贡献图和季节性热力图为基础,将连续的定量指标映射到具体的日历日期上,帮助用户一目了然地识别高活跃度峰值、周末变化以及跨月的季节性模式。
日历图的工作原理
在 Apache ECharts 中,日历图使用一个专用的日历坐标系,结合热力图或散点图系列类型。与标准的笛卡尔 X 和 Y 轴不同,ECharts 使用日期字符串自动计算日期和月份的网格位置。
1. 基础设置
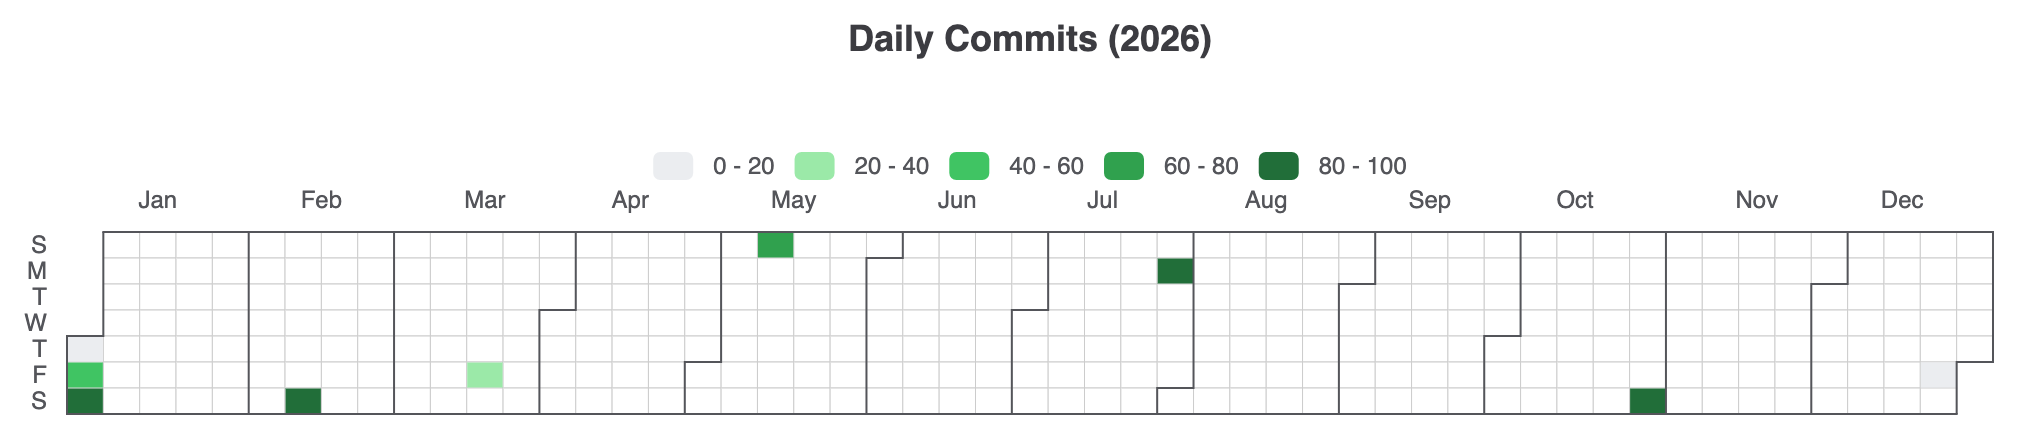
要创建一个基础的年度日历热力图,需定义一个日历组件并指定一个范围(例如,'2026'),附加一个视觉映射以控制指标的颜色渐变,并传入格式为['YYYY-MM-DD', 值]':
ECharts
在 VPasCode 中编辑 ECharts
ECharts
Edit ECharts in VPasCode
option = {
    title: {
        top: 10,
        left: 'center',
        text: '每日提交 (2026)'
    },
    tooltip: {
        formatter: function (params) {
            return params.value[0] + ': ' + params.value[1] + ' 次提交';
        }
    },
    visualMap: {
        min: 0,
        max: 100,
        type: 'piecewise',
        orient: 'horizontal',
        left: 'center',
        top: 65,
        inRange: {
            color: ['#ebedf0', '#9be9a8', '#40c463', '#30a14e', '#216e39']
        }
    },
    calendar: {
        top: 120,
        left: 30,
        right: 30,
        cellSize: ['auto', 13],
        range: '2026',
        itemStyle: {
            borderWidth: 0.5,
            borderColor: '#ccc'
        },
        yearLabel: { show: false }
    },
    series: {
        type: 'heatmap',
        coordinateSystem: 'calendar',
        data: [
            ['2026-01-01', 12], ['2026-01-02', 45], ['2026-01-03', 88],
            ['2026-02-14', 95], ['2026-03-20', 30], ['2026-05-10', 65],
            ['2026-07-27', 82], ['2026-10-31', 99], ['2026-12-25', 10]
        ]
    }
};
高级结构技术
日历图可以调整为垂直滚动布局,或通过散点图表示方式定制,以可视化离散的每日指标。
1. 垂直多月日历视图
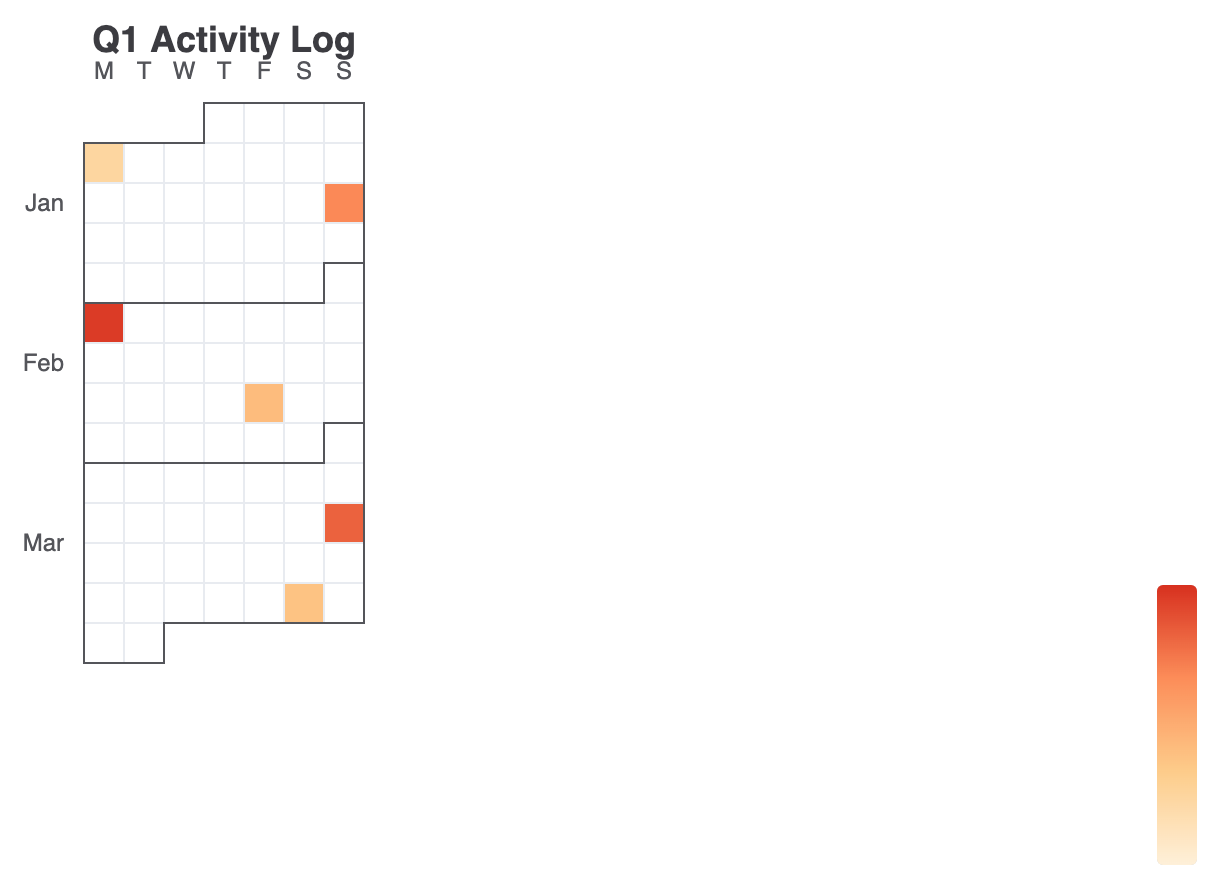
更改orient: 'vertical'在日历组件上设置以垂直堆叠月份——非常适合高大的仪表板小部件或移动布局:
ECharts
在 VPasCode 中编辑 ECharts
ECharts
Edit ECharts in VPasCode
option = {
    title: {
        text: '第一季度活动日志',
        left: 'center'
    },
    tooltip: {},
    visualMap: {
        min: 0,
        max: 500,
        type: 'continuous',
        orient: 'vertical',
        right: 10,
        top: 'center',
        inRange: {
            color: ['#fef0d9', '#fdcc8a', '#fc8d59', '#d7301f']
        }
    },
    calendar: {
        top: 60,
        left: 'center',
        orient: 'vertical',
        range: ['2026-01-01', '2026-03-31'],
        cellSize: [20, 20],
        yearLabel: { show: false },
        dayLabel: {
            firstDay: 1, // 星期从周一开始
            nameMap: 'en'
        },
        monthLabel: { nameMap: 'en' }
    },
    series: {
        type: 'heatmap',
        coordinateSystem: 'calendar',
        data: [
            ['2026-01-05', 120], ['2026-01-18', 340], ['2026-02-02', 480],
            ['2026-02-20', 210], ['2026-03-15', 410], ['2026-03-28', 190]
        ]
    }
};
布局与样式的精细调整
将日历坐标系与散点系列结合,可依据强度而非仅靠颜色块来调整点的大小。
1. 散点气泡日历
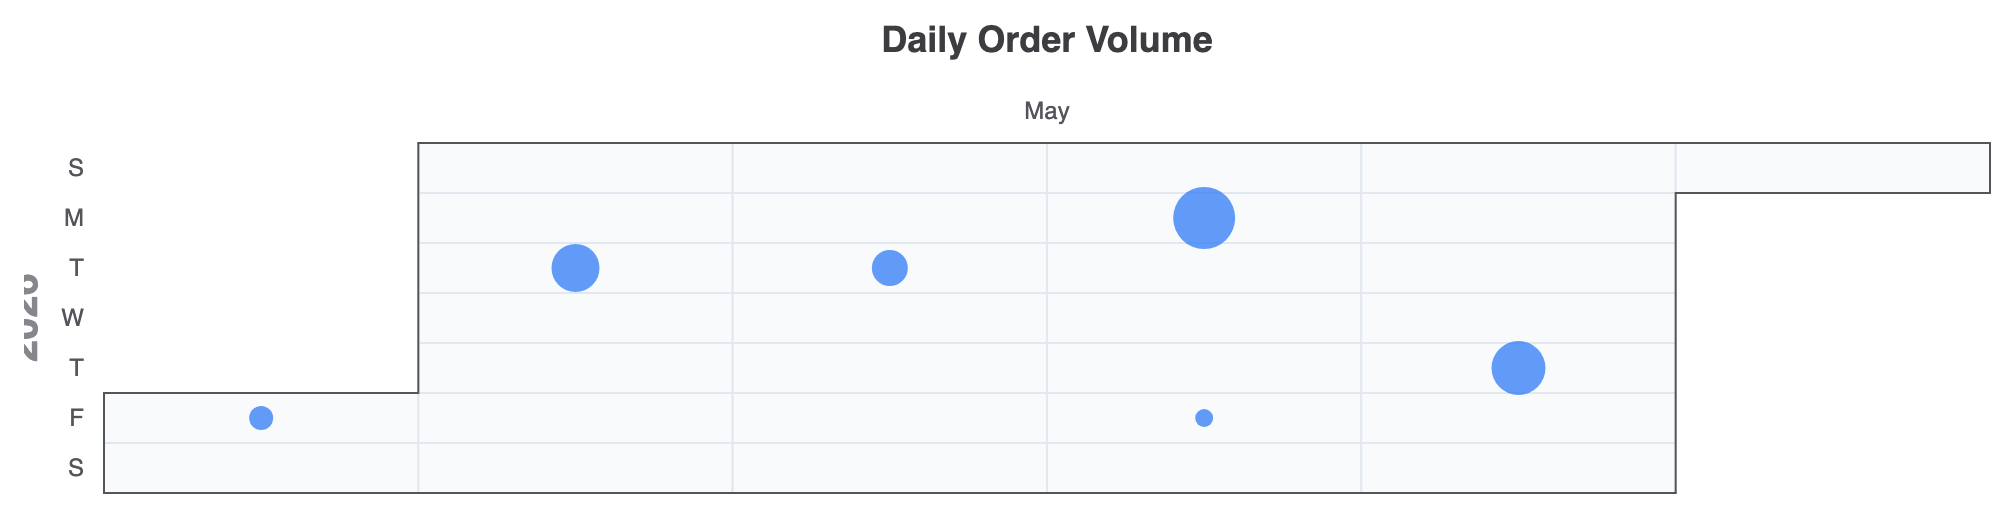
使用 type: 'scatter' 在一个 日历坐标系可创建交互式气泡风格的每日指标:
ECharts
在 VPasCode 中编辑 ECharts
ECharts
Edit ECharts in VPasCode
option = {
    title: {
        text: '每日订单量',
        left: 'center'
    },
    tooltip: {
        formatter: function (params) {
            return params.value[0] + ': ' + params.value[1] + ' 单订单';
        }
    },
    calendar: {
        top: 80,
        left: 40,
        right: 40,
        range: '2026-05',
        cellSize: ['auto', 25],
        itemStyle: {
            color: '#f8fafc',
            borderWidth: 1,
            borderColor: '#e2e8f0'
        }
    },
    series: {
        type: 'scatter',
        coordinateSystem: 'calendar',
        symbolSize: function (val) {
            return val[1] / 10; // 根据订单数量调整气泡大小
        },
        itemStyle: {
            color: '#3b82f6',
            opacity: 0.8
        },
        data: [
            ['2026-05-01', 120], ['2026-05-05', 240], ['2026-05-12', 180],
            ['2026-05-18', 310], ['2026-05-22', 90], ['2026-05-28', 270]
        ]
    }
};
战略最佳实践
- 日期格式匹配 ISO 标准: 确保系列数据数组中的日期遵循标准
'YYYY-MM-DD'字符串格式,以便日历网格能准确映射记录。 - 配置
firstDay以确保区域一致性: 使用dayLabel.firstDay(设置为0用于周日或1用于周一),以符合您受众的本地日历惯例。 - 配对分段式视觉映射以显示贡献: 在渲染 GitHub 风格的提交图时,请使用
分段式视觉映射类型,采用离散的颜色停靠点而非连续渐变,以获得更清晰的分类视觉步骤。