


In the rapidly evolving landscape of modern power systems, the integration of Distributed Energy Resources (DERs)—such as rooftop solar panels, small wind turbines, and battery storage units—presents significant challenges for grid operators. Unlike traditional centralized generation, DERs are decentralized, intermittent, and often managed by third-party owners. To maintain grid stability, voltage regulation, and frequency control, a Smart Grid Monitoring System must orchestrate complex interactions between DER units, management systems (DERMS), and external data services like weather forecasts.
Visualizing these interactions is critical for software architects and energy engineers. A well-structured sequence diagram clarifies the temporal flow of messages, the state of participants during operations, and the logic behind demand response strategies. By leveraging diagram-as-code with PlantUML in VPasCode, teams can prototype these architectural flows instantly without the overhead of manual drawing tools. This approach ensures documentation remains synchronized with the system logic, supporting agile development and clear communication across technical and operational stakeholders.
Understanding the Model: Purpose, Scope & Problem Framing
Diagram Abstraction & Representation
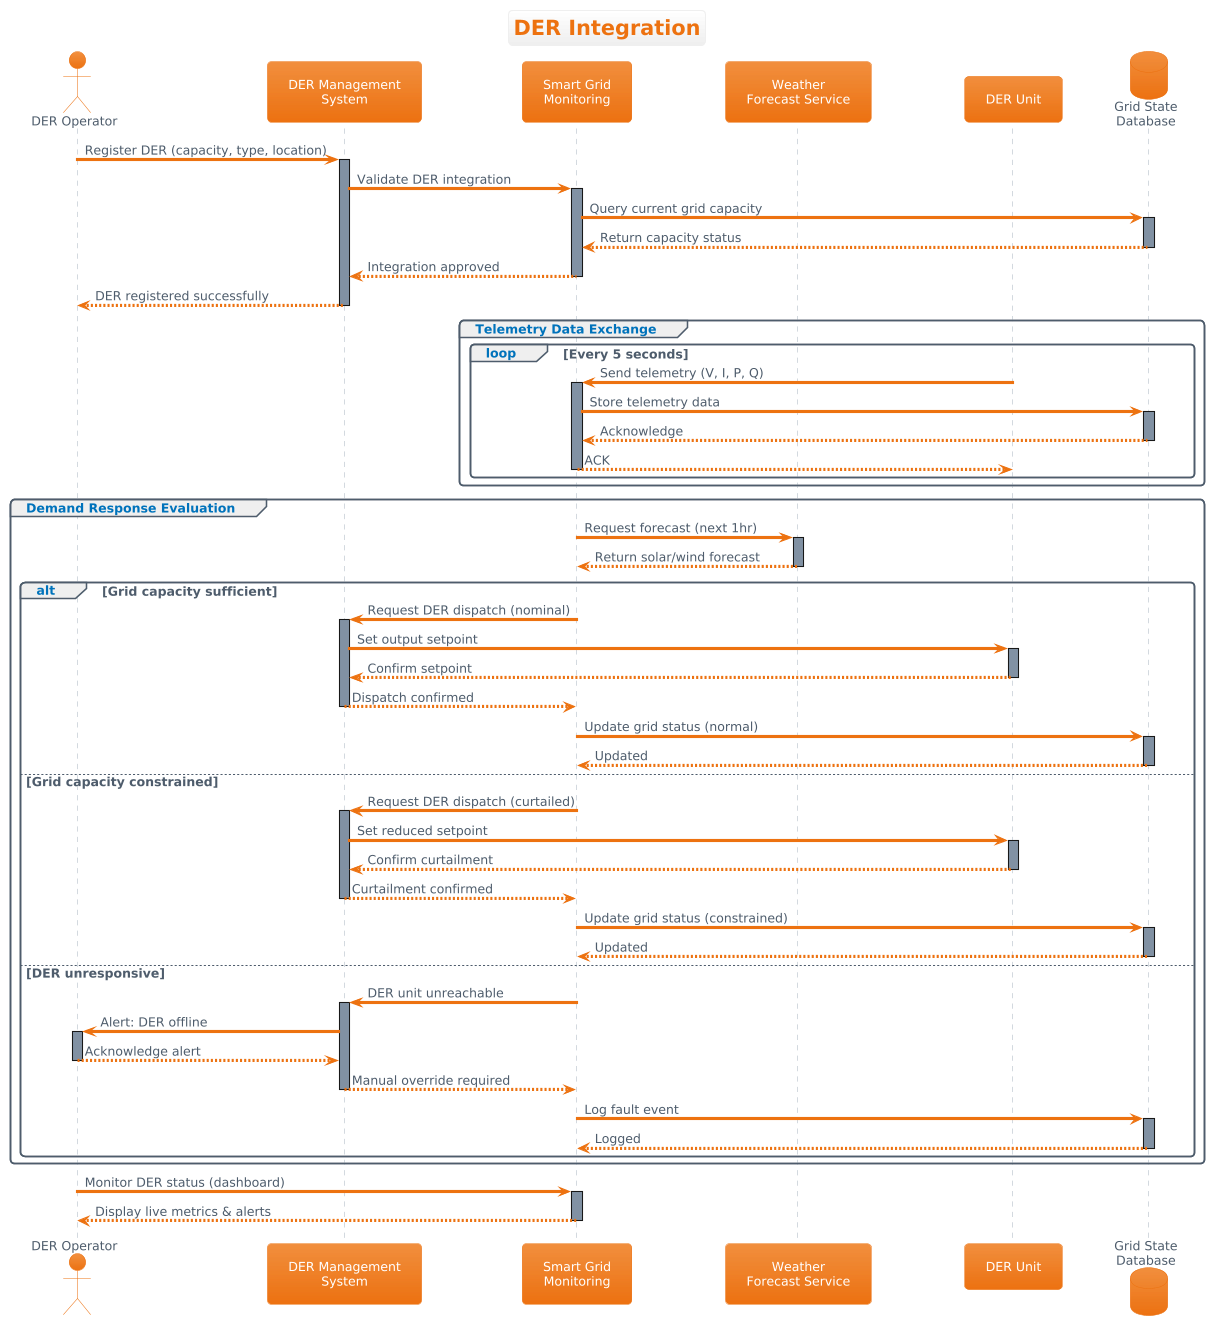
This tutorial focuses on a Sequence Diagram, the standard notation for modeling object-oriented or service-oriented interactions over time. In the context of Smart Grids, sequence diagrams are the preferred method for defining the protocol between the DER Management System (DERMS) and the physical DER units. They answer critical questions: Who initiates the request? What data is exchanged during telemetry? How does the system handle grid constraints or faults?
The diagram models the lifecycle of a DER unit, starting from registration and moving into active telemetry exchange. It specifically highlights the Demand Response logic, where the grid may request a DER to increase output (dispatch) or decrease output (curtailment) based on real-time capacity and weather forecasts.
Target Domain Scope & Scenario
The scope of this model is strictly limited to the interaction layer of the Smart Grid Monitoring System. It does not model the internal database schema or the physical hardware of the solar panels. Instead, it abstracts these into participants like DER Unit and Grid State Database. The scenario covers three primary operational modes:
- Registration: Onboarding a new DER unit into the monitoring network.
- Telemetry: Continuous data exchange (Voltage, Current, Power) at regular intervals.
- Demand Response: Conditional logic handling normal operation, capacity constraints, and fault scenarios.
Key Takeaways & Educational Insights
By constructing this diagram in VPasCode, you will gain insights into:
- How to structure complex conditional logic using
altandelseblocks for grid constraint handling. - The importance of activation bars to visualize the lifespan of active participants.
- How to group related interactions (like telemetry loops) to reduce visual clutter.
Complete Diagram & Full Source Code
Below is the complete blueprint for the DER Integration sequence diagram. You can view the rendered result immediately using the interactive editor below.
@startuml
!theme aws-orange
title DER Integration

/'
This sequence diagram illustrates the Distributed Energy Resource (DER) integration
scenario in a Smart Grid Monitoring System. It covers the registration of a DER unit,
telemetry data exchange, demand response evaluation, and alternative handling for
grid constraint scenarios. The diagram also shows fault handling when the DER is
unresponsive.
'/

actor "DER Operator" as Operator
participant "DER Management\nSystem" as DERMS
participant "Smart Grid\nMonitoring" as GridMonitor
participant "Weather\nForecast Service" as Weather
participant "DER Unit" as DERUnit
database "Grid State\nDatabase" as GridDB

Operator -> DERMS: Register DER (capacity, type, location)
activate DERMS
DERMS -> GridMonitor: Validate DER integration
activate GridMonitor
GridMonitor -> GridDB: Query current grid capacity
activate GridDB
GridDB --> GridMonitor: Return capacity status
deactivate GridDB
GridMonitor --> DERMS: Integration approved
deactivate GridMonitor
DERMS --> Operator: DER registered successfully
deactivate DERMS

group Telemetry Data Exchange
    loop Every 5 seconds
        DERUnit -> GridMonitor: Send telemetry (V, I, P, Q)
        activate GridMonitor
        GridMonitor -> GridDB: Store telemetry data
        activate GridDB
        GridDB --> GridMonitor: Acknowledge
        deactivate GridDB
        GridMonitor --> DERUnit: ACK
        deactivate GridMonitor
    end
end

group Demand Response Evaluation
    activate GridMonitor
    GridMonitor -> Weather: Request forecast (next 1hr)
    activate Weather
    Weather --> GridMonitor: Return solar/wind forecast
    deactivate Weather

    alt Grid capacity sufficient
        GridMonitor -> DERMS: Request DER dispatch (nominal)
        activate DERMS
        DERMS -> DERUnit: Set output setpoint
        activate DERUnit
        DERUnit --> DERMS: Confirm setpoint
        deactivate DERUnit
        DERMS --> GridMonitor: Dispatch confirmed
        deactivate DERMS
        GridMonitor -> GridDB: Update grid status (normal)
        activate GridDB
        GridDB --> GridMonitor: Updated
        deactivate GridDB

    else Grid capacity constrained
        GridMonitor -> DERMS: Request DER dispatch (curtailed)
        activate DERMS
        DERMS -> DERUnit: Set reduced setpoint
        activate DERUnit
        DERUnit --> DERMS: Confirm curtailment
        deactivate DERUnit
        DERMS --> GridMonitor: Curtailment confirmed
        deactivate DERMS
        GridMonitor -> GridDB: Update grid status (constrained)
        activate GridDB
        GridDB --> GridMonitor: Updated
        deactivate GridDB

    else DER unresponsive
        GridMonitor -> DERMS: DER unit unreachable
        activate DERMS
        DERMS -> Operator: Alert: DER offline
        activate Operator
        Operator --> DERMS: Acknowledge alert
        deactivate Operator
        DERMS --> GridMonitor: Manual override required
        deactivate DERMS
        GridMonitor -> GridDB: Log fault event
        activate GridDB
        GridDB --> GridMonitor: Logged
        deactivate GridDB
    end
    deactivate GridMonitor
end

Operator -> GridMonitor: Monitor DER status (dashboard)
activate GridMonitor
GridMonitor --> Operator: Display live metrics & alerts
deactivate GridMonitor
@endumlStep-by-Step Architectural Walkthrough
Building this diagram from scratch in VPasCode involves four logical phases. We will break down the code structure to understand how each component contributes to the overall architecture.
Phase 1: Canvas Configuration & Layout Directives
Before defining actors, we set the visual theme and title. This establishes the branding and context immediately.
Use the !theme directive to apply the aws-orange theme, which provides a professional color palette suitable for enterprise energy dashboards. The title directive names the diagram, and the comment block provides essential documentation.
!theme aws-orange
title DER Integration

/'
This sequence diagram illustrates the Distributed Energy Resource (DER) integration
scenario in a Smart Grid Monitoring System...
'/
Phase 2: Declaring Core Entities, Actors, and Boundaries
Next, we define the participants. In a sequence diagram, participants represent the system components involved in the interaction. We use specific stereotypes to distinguish between human actors, software services, and databases.
For example, actor represents the human operator, while database represents the persistent storage layer. This distinction helps readers quickly identify the type of system component.
actor "DER Operator" as Operator
participant "DER Management
System" as DERMS
participant "Smart Grid
Monitoring" as GridMonitor
database "Grid State
Database" as GridDB
Phase 3: Mapping Data Flows & Key Interactions
The core logic of the sequence diagram lies in the message flows. We use solid arrows (->) for synchronous calls and dashed arrows (-->) for return messages. The activate and deactivate keywords define the lifetime of a participant’s focus.
During the registration phase, the Operator initiates the process, and the DERMS validates the request with the GridMonitor. This creates a clear vertical flow of control.
Operator -> DERMS: Register DER (capacity, type, location)
activate DERMS
DERMS -> GridMonitor: Validate DER integration
activate GridMonitor
Phase 4: Grouping, Annotations & Visual Polish
To manage complexity, we group related interactions. The group directive allows us to encapsulate the Telemetry Data Exchange and Demand Response Evaluation into distinct visual sections. Inside the telemetry group, we use a loop to indicate that data is sent repeatedly every 5 seconds.
For the Demand Response logic, we use alt (alternative) blocks to handle conditional outcomes such as grid capacity sufficiency or DER unresponsiveness. This is crucial for modeling real-world fault tolerance.
group Telemetry Data Exchange
    loop Every 5 seconds
        DERUnit -> GridMonitor: Send telemetry (V, I, P, Q)
        ...
    end
end

alt Grid capacity sufficient
    ...
else Grid capacity constrained
    ...
else DER unresponsive
    ...
end
Syntax & Keyword Deep Dive
Understanding the specific PlantUML syntax used in this diagram is essential for extending the model later. Here are the key keywords and conventions utilized:
!theme: Applies a predefined visual style to the entire diagram. In this case,aws-orangesets the color scheme.actor/participant/database: Defines the type of participant.actoris typically a stick figure,participantis a rectangle, anddatabaseis a cylinder.->and-->:->denotes a synchronous message (the sender waits for a response), while-->denotes a return message or an asynchronous acknowledgment.activateanddeactivate: These keywords control the appearance of the activation bar (the rectangle on the lifeline), indicating when a participant is actively processing a request.group: Creates a rectangular box to logically separate different parts of the diagram, such as loops or specific business processes.loop: Indicates that the enclosed interaction repeats for a specified condition or time period.alt/else: Represents conditional logic. The diagram renders different paths based on the condition (e.g., if capacity is sufficient vs. constrained)./' ... '/: Used for multi-line comments that are visible in the rendered diagram as a note, providing context without affecting the logic.
Best Practices & Pitfalls to Avoid
When building sequence diagrams for complex energy systems, adhering to best practices ensures clarity and maintainability.
- Keep Lifelines Vertical and Consistent: Always maintain the order of participants. Moving participants around mid-diagram confuses the reader. Keep
DERMSandGridMonitorin fixed positions. - Limit Scope per Diagram: Do not try to model every single API call. This diagram focuses on the high-level flow. If you need to detail the
Weatherservice internals, create a separate diagram. - Use Meaningful Labels: Message labels should describe the intent, not just the data payload. Use
Request DER dispatchinstead ofPOST /dispatchfor better readability. - Handle Faults Explicitly: As seen in the
else DER unresponsiveblock, always model error paths. In energy systems, knowing how the system reacts to offline units is as important as knowing how it reacts to normal operation.
Start Building DER Integration Diagrams Faster with VPasCode
Instantly prototype and visualize complex Smart Grid interactions in your browser with VPasCode, the free PlantUML editor for energy architects.