


In the high-stakes environment of financial services, the integrity of transaction processing relies heavily on real-time risk assessment. A robust Risk Management System must not only process payments but also intelligently evaluate them against historical patterns and machine learning models to prevent fraudulent activities. However, designing these complex workflows can be challenging without a shared visual language that bridges the gap between business logic and technical implementation.
This is where diagramming-as-code becomes invaluable. By using PlantUML, architects and developers can define the temporal flow of interactions between components—such as the Transaction Monitoring System, Fraud Detection Engine, and Alert Management System—in a structured, version-free, text-based format. This approach enhances architectural clarity, allowing teams to prototype visual models rapidly without the overhead of graphical drag-and-drop tools.
Using VPasCode, the free web-based diagram-as-code editor, you can render these diagrams instantly in the browser. This tutorial walks you through building a professional sequence diagram for a Fraud Detection Alert Process, demonstrating how to model conditional logic, lifeline activations, and multi-party interactions critical to modern financial security infrastructures.
Understanding the Model: Purpose, Scope & Problem Framing
Diagram Abstraction & Representation
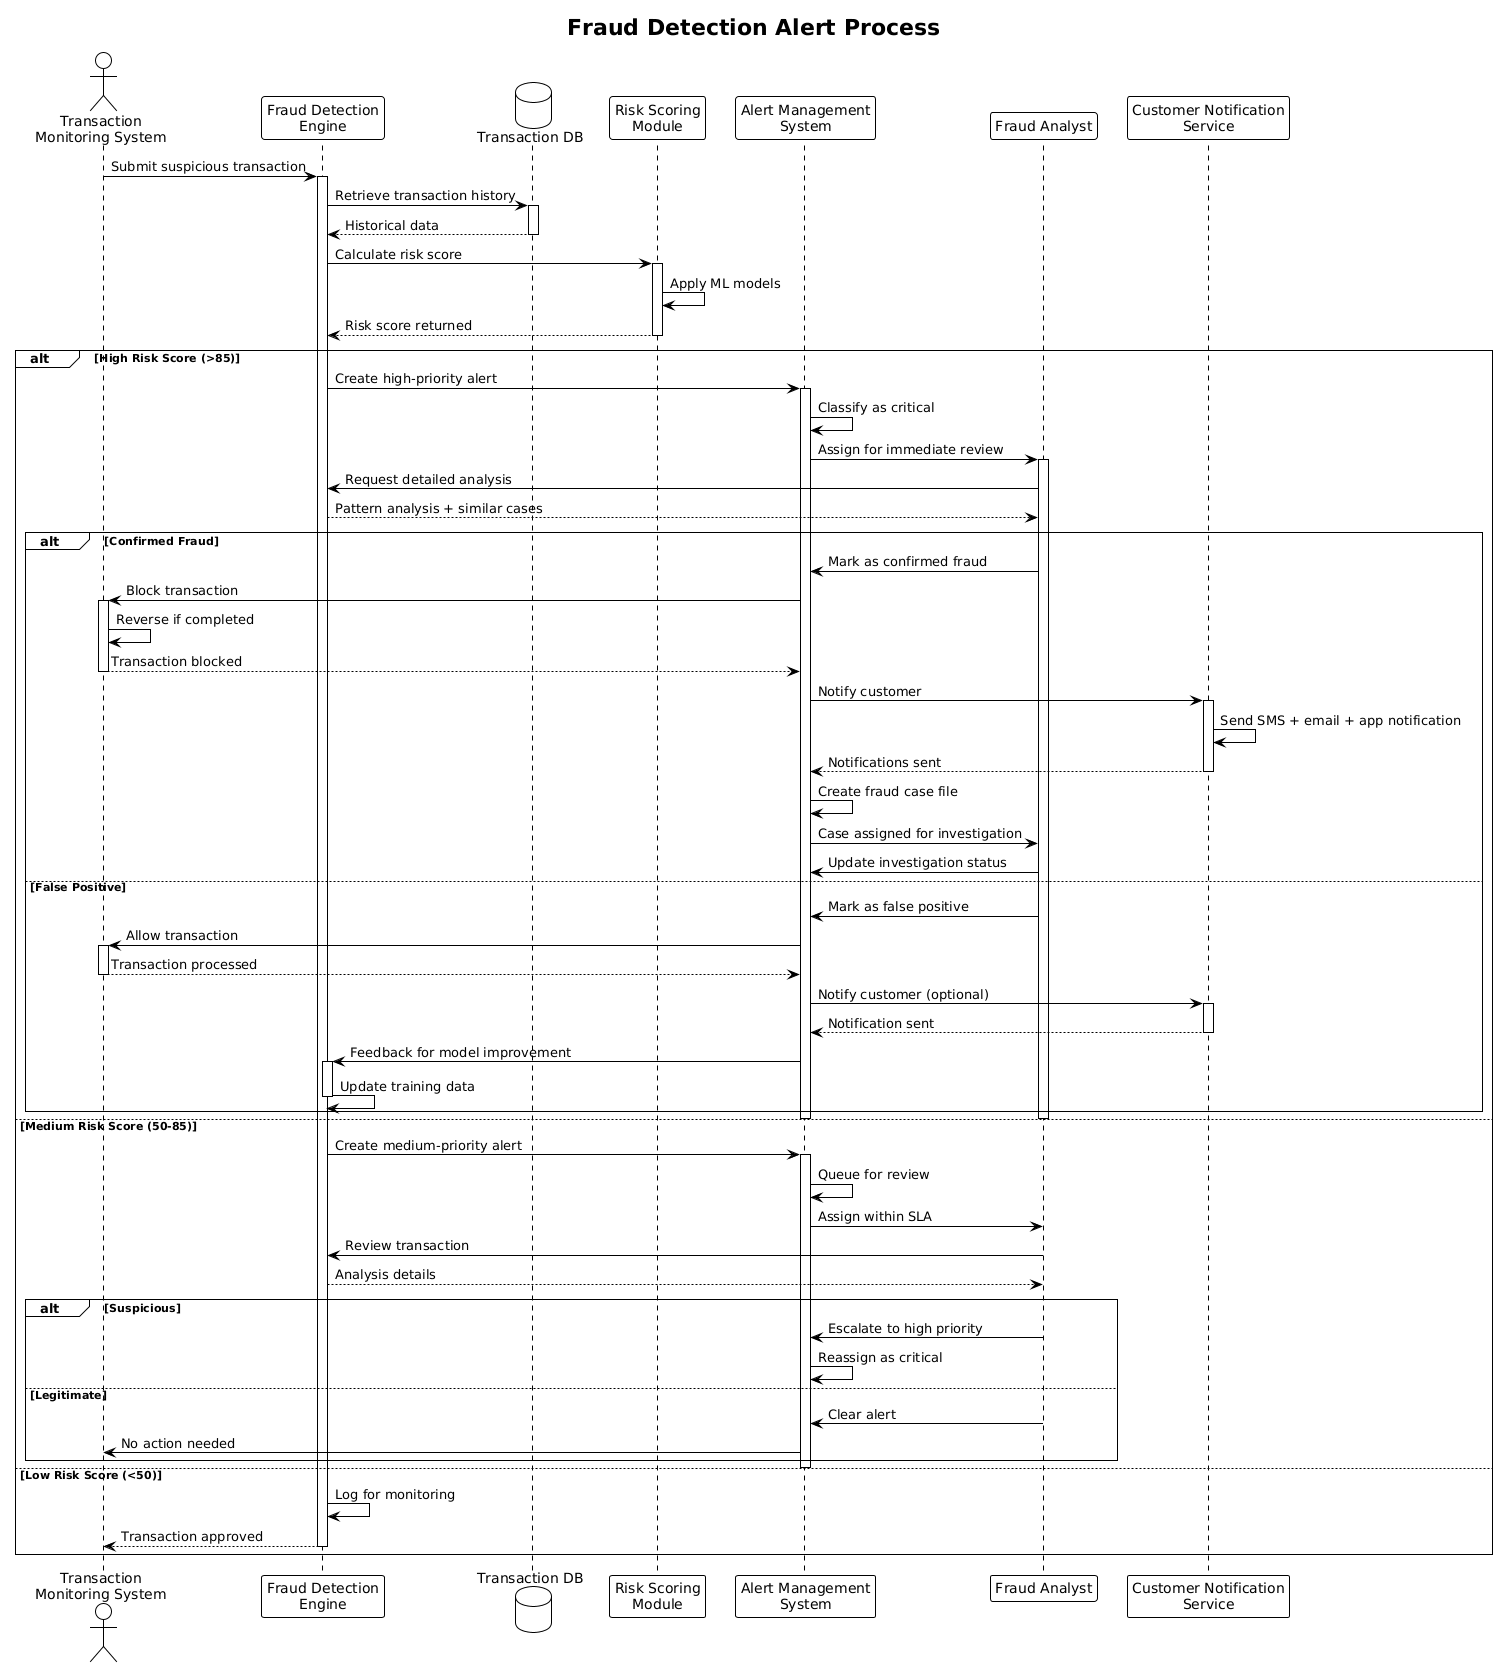
A Sequence Diagram is the ideal notation for visualizing the runtime behavior of a system. In this specific model, we are not focusing on static class structures or database schemas; instead, we are modeling the temporal flow of messages between system components. Each vertical line represents a lifeline (an actor or object), and horizontal arrows represent the messages passed between them. This abstraction allows stakeholders to see exactly who triggers an action, who processes the risk score, and how alerts are routed based on severity levels.
Target Domain Scope & Scenario
The scope of this diagram is strictly bounded to the Fraud Detection Alert Process within a Risk Management System. It covers the journey from a suspicious transaction submission to the final resolution (either blocking the transaction or clearing it as a false positive). It intentionally excludes backend database persistence logic or UI rendering details to maintain focus on the interaction logic and decision-making flow.
Key Takeaways & Educational Insights
By constructing this model, you will gain insights into:
- Conditional Logic: How to model different risk tiers (High, Medium, Low) using combined fragments.
- State Management: Understanding when components are active versus idle using activation bars.
- Human-in-the-Loop: Representing the critical role of the Fraud Analyst in the automated workflow.
Complete Diagram & Full Source Code
Below is the finalized blueprint for the Fraud Detection Alert Process. You can view the rendered output immediately and edit the code directly in the browser.
@startuml
!theme plain

title Fraud Detection Alert Process

actor "Transaction\nMonitoring System" as TMS
participant "Fraud Detection\nEngine" as FDE
database "Transaction DB" as TDB
participant "Risk Scoring\nModule" as RSM
participant "Alert Management\nSystem" as AMS
participant "Fraud Analyst" as Analyst
participant "Customer Notification\nService" as CNS

TMS -> FDE: Submit suspicious transaction
activate FDE
FDE -> TDB: Retrieve transaction history
activate TDB
TDB --> FDE: Historical data
deactivate TDB

FDE -> RSM: Calculate risk score
activate RSM
RSM -> RSM: Apply ML models
RSM --> FDE: Risk score returned
deactivate RSM

alt High Risk Score (>85)
    FDE -> AMS: Create high-priority alert
    activate AMS
    AMS -> AMS: Classify as critical
    AMS -> Analyst: Assign for immediate review
    activate Analyst

    Analyst -> FDE: Request detailed analysis
    FDE --> Analyst: Pattern analysis + similar cases

    alt Confirmed Fraud
        Analyst -> AMS: Mark as confirmed fraud
        AMS -> TMS: Block transaction
        activate TMS
        TMS -> TMS: Reverse if completed
        TMS --> AMS: Transaction blocked
        deactivate TMS

        AMS -> CNS: Notify customer
        activate CNS
        CNS -> CNS: Send SMS + email + app notification
        CNS --> AMS: Notifications sent
        deactivate CNS

        AMS -> AMS: Create fraud case file
        AMS -> Analyst: Case assigned for investigation
        Analyst -> AMS: Update investigation status

    else False Positive
        Analyst -> AMS: Mark as false positive
        AMS -> TMS: Allow transaction
        activate TMS
        TMS --> AMS: Transaction processed
        deactivate TMS

        AMS -> CNS: Notify customer (optional)
        activate CNS
        CNS --> AMS: Notification sent
        deactivate CNS

        AMS -> FDE: Feedback for model improvement
        activate FDE
        FDE -> FDE: Update training data
        deactivate FDE
    end

    deactivate Analyst
    deactivate AMS

else Medium Risk Score (50-85)
    FDE -> AMS: Create medium-priority alert
    activate AMS
    AMS -> AMS: Queue for review
    AMS -> Analyst: Assign within SLA

    Analyst -> FDE: Review transaction
    FDE --> Analyst: Analysis details

    alt Suspicious
        Analyst -> AMS: Escalate to high priority
        AMS -> AMS: Reassign as critical
    else Legitimate
        Analyst -> AMS: Clear alert
        AMS -> TMS: No action needed
    end

    deactivate AMS

else Low Risk Score (<50)
    FDE -> FDE: Log for monitoring
    FDE --> TMS: Transaction approved
    deactivate FDE
end
@endumlStep-by-Step Architectural Walkthrough
Building a complex sequence diagram requires a structured approach. We will deconstruct the creation process into four logical phases to ensure clarity and maintainability.
Phase 1: Canvas Configuration & Layout Directives
Before defining any participants, we must set the visual theme and title. This establishes the aesthetic consistency for the diagram. In this case, we use the !theme plain directive to ensure a clean, minimalistic look that focuses attention on the data flow rather than decorative elements.
@startuml
!theme plain

title Fraud Detection Alert Process
The @startuml and @enduml tags define the boundaries of the diagram, ensuring the parser knows where the code begins and ends.
Phase 2: Declaring Core Entities, Actors, and Boundaries
Next, we define the lifelines. In a finance context, precision in naming is crucial. We distinguish between automated systems (Participants), human operators (Actors), and data stores (Databases).
actor "Transaction
Monitoring System" as TMS
participant "Fraud Detection
Engine" as FDE
database "Transaction DB" as TDB
participant "Risk Scoring
Module" as RSM
participant "Alert Management
System" as AMS
participant "Fraud Analyst" as Analyst
participant "Customer Notification
Service" as CNS
Here, actor is used for external systems initiating the flow, while participant is used for internal services. The database keyword explicitly marks the storage component. Using abbreviations like TMS and FDE keeps the diagram less cluttered while maintaining readability.
Phase 3: Mapping Data Flows & Key Interactions
The core logic of the diagram lies in the interaction messages. We start with the initial trigger from the Transaction Monitoring System.
TMS -> FDE: Submit suspicious transaction
activate FDE
FDE -> TDB: Retrieve transaction history
activate TDB
TDB --> FDE: Historical data
deactivate TDB
Notice the use of -> for synchronous requests and --> for return messages. The activate and deactivate keywords visually represent the lifespan of an object’s active processing, which is vital for understanding concurrency and load in the architecture.
Phase 4: Grouping, Annotations & Visual Polish
Finally, we implement the conditional logic using combined fragments. The alt keyword allows us to model the decision tree based on the risk score calculated by the Risk Scoring Module.
alt High Risk Score (>85)
    ... logic for high risk ...
else Medium Risk Score (50-85)
    ... logic for medium risk ...
else Low Risk Score (<50)
    ... logic for low risk ...
end
This structure ensures that the diagram covers all potential outcomes of the risk calculation, making the documentation complete and robust.
Syntax & Keyword Deep Dive
To master PlantUML sequence diagrams, understanding the specific syntax keywords is essential. Below are the critical elements used in this tutorial:
actor: Defines an external entity or user that initiates the process. In this diagram, it represents the Transaction Monitoring System.participant: Represents a software component or service within the system boundary.database: Specifies a data storage component, visually distinguished from standard participants.->: Indicates a synchronous message or request sent from one lifeline to another.-->: Indicates a return message or response sent back to the caller.activate/deactivate: These keywords control the activation bar on the lifeline, showing when a component is actively processing a task.alt/else/end: Combined fragment keywords used to define alternative paths or conditional logic blocks.
Best Practices & Pitfalls to Avoid
When creating technical diagrams for finance or engineering teams, adherence to best practices ensures the documentation remains useful over time.
- Maintain Consistent Abstraction Levels: Do not mix high-level business flows with low-level code implementation details. Keep the focus on component interactions, not internal variable logic.
- Use Descriptive Labels: Avoid generic labels like “Process Data.” Instead, use specific terms like “Calculate Risk Score” or “Retrieve Transaction History” to improve clarity.
- Manage Visual Complexity: If a sequence becomes too long, consider splitting it into multiple diagrams (e.g., one for High Risk, one for Low Risk) rather than cramming everything into a single view.
- Validate Logic Early: Use the live preview in VPasCode to test syntax changes instantly. This prevents the accumulation of rendering errors that can obscure the diagram’s meaning.
Start Building Sequence Diagrams Faster with VPasCode
Instantly prototype and render complex PlantUML sequence diagrams online without installing any tools or configuring local environments.