


In modern healthcare IT infrastructure, clarity is not just a design preference—it is a regulatory and operational necessity. A Radiology Information System (RIS) acts as the central nervous system for a radiology department, managing patient demographics, scheduling exams, tracking workflow, and integrating with external modalities like MRI or CT scanners. When these complex systems are poorly documented, miscommunication between developers, clinicians, and IT administrators can lead to critical bottlenecks in patient care. Visual modeling bridges this gap, transforming abstract requirements into a concrete blueprint that stakeholders can inspect and validate.

Using a diagram-as-code approach with PlantUML in VPasCode allows architects to maintain living documentation that stays synchronized with the system’s evolution. By defining components and interfaces in text, you ensure that the architecture remains versionable, testable, and easily shareable across teams without the overhead of proprietary drawing tools. This tutorial guides you through constructing a professional-grade component diagram that delineates the boundaries between Patient Management, Order & Scheduling, Workflow & Reporting, and External Integration.
Understanding the Model: Purpose, Scope & Problem Framing
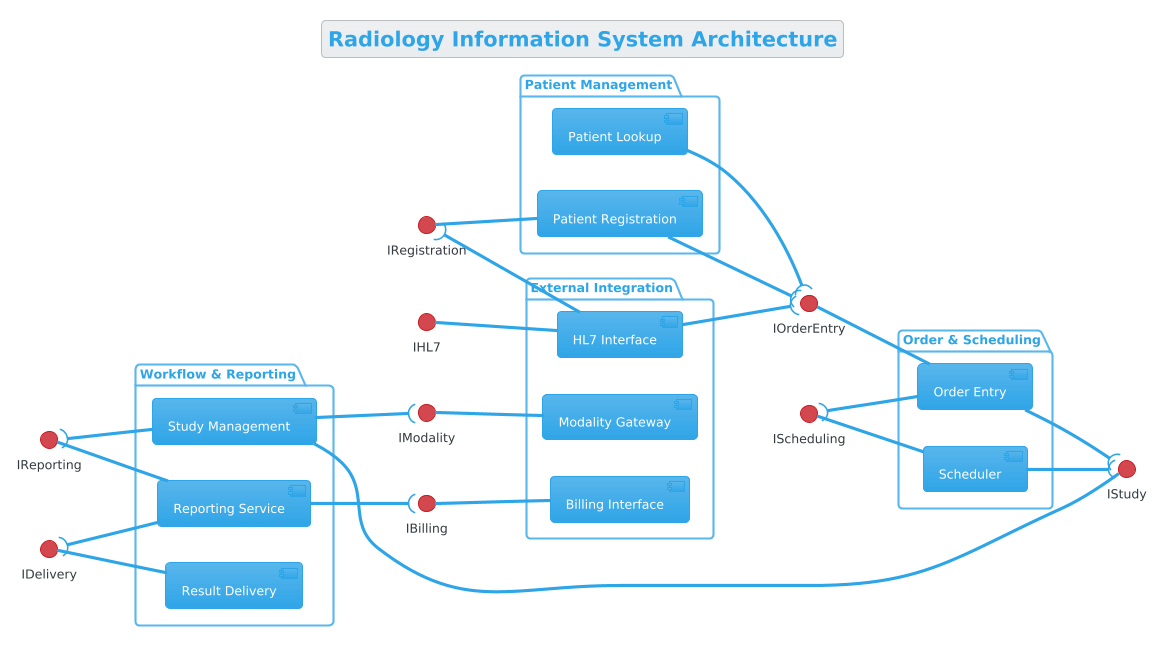
A component diagram is the ideal abstraction for high-level system architecture because it focuses on the functional building blocks and their interactions rather than implementation details. In the context of a Radiology Information System, this diagram serves to map the logical flow of data from patient registration through to billing and external reporting. It defines the “contract” between different services, ensuring that the Order Entry module knows how to request scheduling, and that the Modality Gateway understands how to receive image data.
The scope of this model covers four primary architectural layers: Patient Management for demographic data, Order & Scheduling for exam logistics, Workflow & Reporting for study management and results, and External Integration for interfacing with hospital-wide systems like Billing or HL7 networks. By visualizing these boundaries, architects can identify single points of failure, ensure proper separation of concerns, and validate that data flows correctly between critical operational domains.
Key takeaways from this model include understanding how to group related components into packages for modularity, how to define Provided Interfaces (capabilities a component offers) versus Required Interfaces (capabilities a component needs), and how to use visual cues like ball-and-socket joints to indicate dependency direction. This clarity is essential for maintaining scalable healthcare software.
Complete Diagram & Full Source Code
Before diving into the syntax, visualize the final outcome. The diagram below represents the complete architecture of the RIS, organized into logical packages with clear interface definitions. You can copy the code below directly into the VPasCode editor to see the live rendering instantly.
@startuml
!theme cerulean
left to right direction

title Radiology Information System Architecture

/'
This component diagram depicts the high-level architecture of a Radiology Information System (RIS), illustrating the primary functional domains and their interactions. The system is organized into distinct layers: Patient Management, Order & Scheduling, Workflow & Reporting, and External Integration. The diagram focuses on how patient demographics, exam orders, and study results flow between components, ensuring seamless integration with external modalities and hospital information systems. It highlights the separation of concerns between scheduling, image acquisition, reporting, and billing to support efficient radiology operations.
'/

package "Patient Management" {
    component "Patient Registration" as Registration
    component "Patient Lookup" as Lookup
}

package "Order & Scheduling" {
    component "Order Entry" as OrderEntry
    component "Scheduler" as Scheduler
}

package "Workflow & Reporting" {
    component "Study Management" as StudyMgmt
    component "Reporting Service" as ReportService
    component "Result Delivery" as ResultDelivery
}

package "External Integration" {
    component "Modality Gateway" as ModalityGW
    component "HL7 Interface" as HL7Interface
    component "Billing Interface" as BillingIF
}

' Provided Interfaces (ball on the left)
interface "IRegistration" as IReg
interface "IOrderEntry" as IOrder
interface "IScheduling" as ISched
interface "IStudy" as IStudy
interface "IReporting" as IReport
interface "IDelivery" as IDelivery
interface "IModality" as IMod
interface "IHL7" as IHL7
interface "IBilling" as IBill

' Required Interfaces (socket on the right)
Registration --( IOrder
Lookup --( IOrder
OrderEntry --( ISched
OrderEntry --( IStudy
Scheduler --( IStudy
StudyMgmt --( IReport
StudyMgmt --( IMod
ReportService --( IDelivery
ReportService --( IBill
HL7Interface --( IReg
HL7Interface --( IOrder

' Provided Interfaces attached to components
IReg -- Registration
IOrder -- OrderEntry
ISched -- Scheduler
IStudy -- StudyMgmt
IReport -- ReportService
IDelivery -- ResultDelivery
IMod -- ModalityGW
IHL7 -- HL7Interface
IBill -- BillingIF

@endumlStep-by-Step Architectural Walkthrough
Phase 1: Canvas Configuration & Layout Directives
The foundation of any PlantUML diagram begins with global directives that control the rendering engine. We start by declaring the theme to ensure the diagram matches the branding of the organization or the visual standards of the project. In this case, we use the cerulean theme, which provides a professional blue-toned aesthetic suitable for enterprise healthcare software.
Next, we define the layout direction. For complex systems like an RIS, a left-to-right flow often reads better than top-to-bottom, as it mimics the chronological progression of patient data through the system.
!theme cerulean
left to right direction
Phase 2: Declaring Core Entities, Actors, and Boundaries
Once the canvas is set, we define the structural boundaries using package blocks. Packages act as namespaces that group related components together, preventing visual clutter and clarifying architectural layers. Here, we create four distinct domains: Patient Management, Order & Scheduling, Workflow & Reporting, and External Integration.
Inside each package, we declare the component shapes. Each component represents a deployable unit of software, such as the Patient Registration module or the Modality Gateway. We assign an alias (e.g., Registration) to keep the code concise while retaining the full name for clarity.
package "Patient Management" {
    component "Patient Registration" as Registration
    component "Patient Lookup" as Lookup
}
Phase 3: Mapping Data Flows & Key Interactions
With components defined, we must establish how they communicate. In PlantUML component diagrams, communication is modeled through interfaces. We first declare the interfaces themselves (e.g., IRegistration, IOrderEntry). These act as the contracts for interaction.
Next, we connect components to these interfaces. We distinguish between Required Interfaces (a component needs this service) and Provided Interfaces (a component offers this service). The syntax uses specific arrows to indicate directionality: --( indicates a required interface (socket), and -- indicates a provided interface (ball).
' Required Interfaces (socket on the right)
Registration --( IOrder
OrderEntry --( ISched

' Provided Interfaces attached to components
IReg -- Registration
IOrder -- OrderEntry
Phase 4: Grouping, Annotations & Visual Polish
Finally, we add metadata to make the diagram self-documenting. We use the title directive to give the diagram a clear header. Additionally, we can include a block comment using /' and '/ to provide a high-level description of the system’s context without cluttering the visual rendering. This ensures that anyone viewing the diagram understands the “why” behind the architecture.
title Radiology Information System Architecture

/'
This component diagram depicts the high-level architecture of a Radiology Information System...
'/
Syntax & Keyword Deep Dive
To master this diagram type, it is essential to understand the specific PlantUML syntax elements used to construct the architecture. Below is a breakdown of the critical keywords and conventions.
package: Defines a logical grouping of components. It helps organize the diagram into manageable sections like “Patient Management” or “External Integration”.component: Represents a functional unit of the system. It is the primary shape used to model software modules.interface: Defines a contract or capability. Interfaces are not components themselves but represent the services they provide or require.--(: This arrow syntax indicates a Required Interface. The component on the left requires the interface on the right. The open parenthesis visually represents a socket.--: When connecting an interface to a component in this direction, it indicates a Provided Interface. The component on the right provides the interface on the left. The ball shape appears on the interface side./' ... '/: Used for multi-line block comments. This text is visible in the source code but does not render as a diagram element, making it perfect for architectural notes.!theme: A directive to apply a specific visual style to the entire diagram, ensuring consistency.
Best Practices & Pitfalls to Avoid
When building complex healthcare system diagrams, adherence to modeling best practices ensures long-term maintainability and clarity.
- Keep Interfaces Explicit: Avoid connecting components directly without interfaces. Always use an interface (ball or socket) to define the contract. This decouples the components and allows for easier swapping of implementations.
- Consistent Naming Conventions: Use clear, descriptive names for both components and interfaces (e.g.,
IOrderEntryvsOrderEntry). This reduces cognitive load when reading the diagram. - Manage Complexity with Packages: Do not place all components on a single canvas. Use
packageblocks to group related functionality. This creates a layered view that is easier to digest. - Document Context: Use the block comment feature to explain the diagram’s purpose. Technical diagrams often lack context; a brief description at the top helps stakeholders understand the scope immediately.
Start Building PlantUML Component Diagrams Faster with VPasCode
Design professional healthcare architecture diagrams instantly in your browser without installing any local tools or dependencies.