


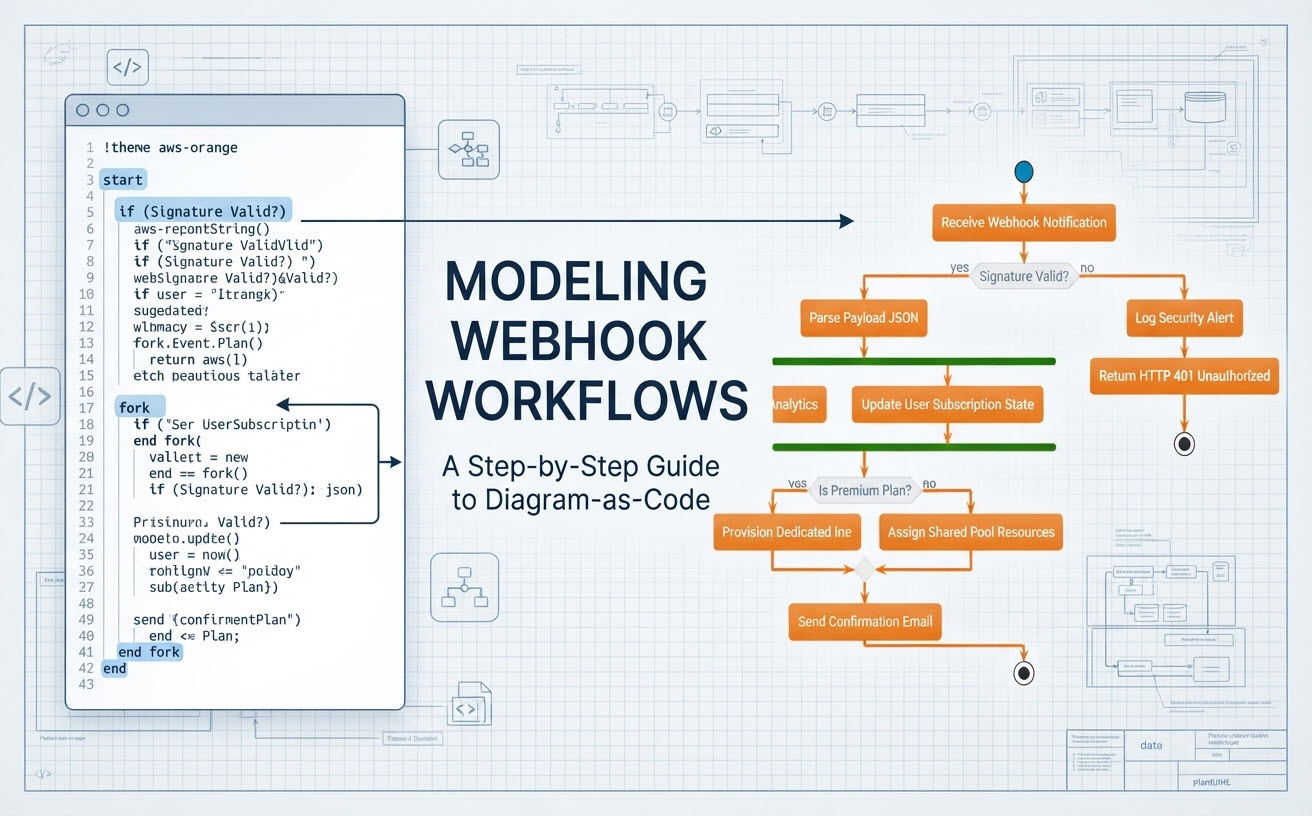
En tant que développeurs et architectes système, nous devons constamment visualiser une logique backend complexe, en particulier des flux asynchrones pilotés par des événements comme le traitement des webhooks. Lors de la construction de ces flux de travail, écrire du code pour générer des visuels est une approche fantastique car elle maintient la documentation claire et programmatique. Aujourd’hui, je vais vous exposer ma démarche exacte alors que je conçois un pipeline d’ingestion et de traitement de webhook de niveau production utilisant PlantUML dans Visual Paradigm VPasCode.
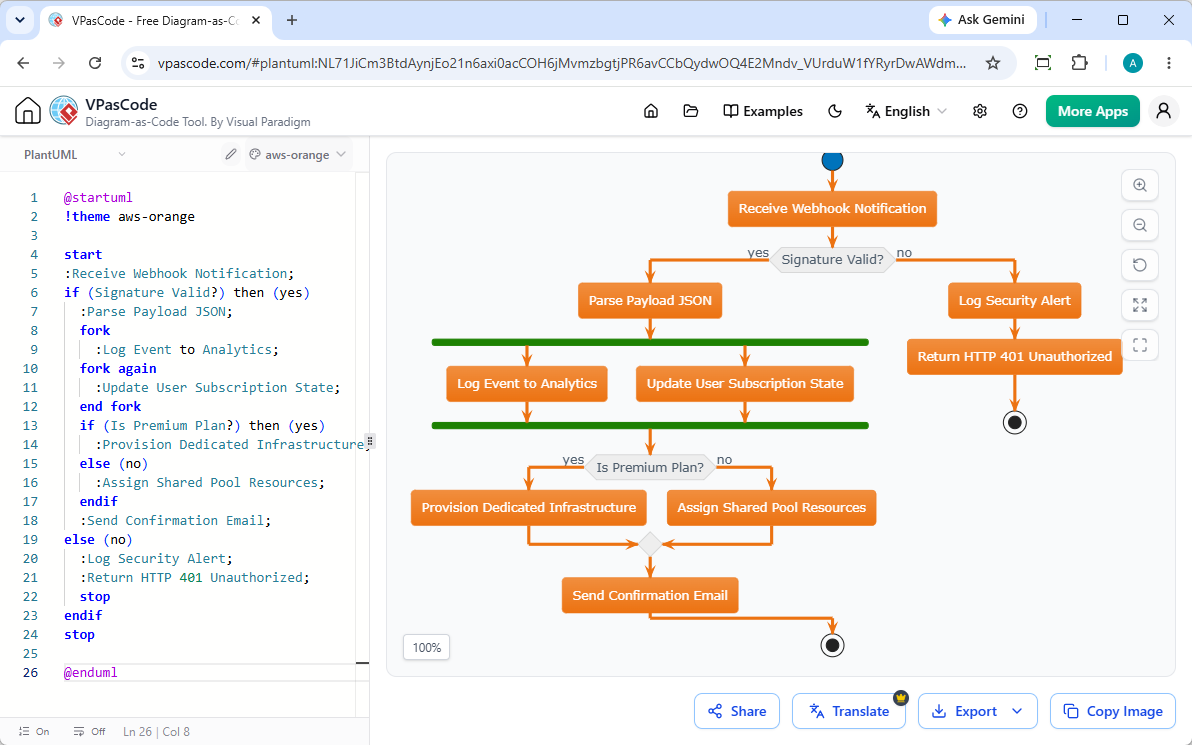
1. Configuration de la structure de base et du thème
Je commence par configurer la structure de base du diagramme d’activité. Chaque script d’activité PlantUML robuste nécessite un point d’entrée clair et un thème visuel unifié pour maintenir des normes professionnelles dans toute la documentation technique.
Au lieu de m’en tenir aux boîtes par défaut au look simple, je choisis d’intégrer le thème intégré aws-orange thème. Cela donne instantanément au diagramme une esthétique propre et native du cloud qui résonne bien avec les architectures d’infrastructure modernes.
@startuml
!theme aws-orange

début
:Réception de la notification webhook;
2. Gestion de l’authentification et des branches conditionnelles
Ensuite, je dois définir le gardien de sécurité principal de notre gestionnaire de webhooks. Lorsqu’un webhook arrive d’un service externe (comme Stripe, GitHub ou AWS), la première vérification opérationnelle doit valider la signature de la requête pour empêcher le spoofing ou l’injection de charge utile non autorisée.
Pour capturer cette logique de décision, j’utilise la syntaxe conditionnelle de PlantUML (si / alors / sinon). Si la signature est valide, le flux de travail avance sur le chemin d’exécution principal. Si elle échoue, le système doit immédiatement interrompre, enregistrer une alerte de sécurité, renvoyer un code de statut HTTP 401 Non autorisé, et se terminer en toute sécurité.
si (Signature Valide ?) alors (oui)
  :Analyser le JSON de la charge utile ;
  ' Les étapes de traitement parallèle vont ici...
sinon (non)
  :Enregistrer l'alerte de sécurité ;
  :Renvoyer HTTP 401 Non autorisé ;
  stop
finsi
3. Orchestration de tâches asynchrones avec des forks
Une fois la charge utile JSON analysée avec succès, les applications backend du monde réel traitent rarement les tâches strictement en série. Par exemple, nous voulons enregistrer l’événement dans notre entrepôt d’analyse et mettre simultanément à jour l’état d’abonnement de l’utilisateur dans notre base de données principale sans se bloquer mutuellement.
Pour représenter cette concurrence, j’introduis un fork bloc. Cela divise visuellement le flux de travail en chemins d’exécution parallèles avant de les synchroniser à nouveau ensemble. C’est une technique essentielle pour modéliser avec précision les architectures de microservices pilotées par des événements.
  fork
    :Enregistrer l'événement dans l'analyse ;
  fork again
    :Mettre à jour l'état d'abonnement de l'utilisateur ;
  end fork
4. Évaluation des niveaux d’abonnement et de la provision de ressources
Après l’achèvement de notre suivi parallèle et des mises à jour d’état, le flux de travail doit inspecter les attributs de l’utilisateur pour déterminer l’allocation de l’infrastructure. Ici, nous rencontrons une structure de décision imbriquée : vérifier si le client appartient à un niveau premium.
S’ils sont abonnés premium, nous provisionnons des ressources d’infrastructure dédiées pour garantir des performances à faible latence. Sinon, nous leur attribuons gracieusement des ressources de pool partagé. Les deux branches convergent éventuellement avant d’envoyer un e-mail de confirmation final à l’utilisateur.
  si (Plan Premium ?) alors (oui)
    :Provisionner l'infrastructure dédiée ;
  sinon (non)
    :Attribuer les ressources du pool partagé ;
  finsi
  :Envoyer l'e-mail de confirmation ;
5. Conclusion du diagramme complet
L’assemblage de tous ces éléments produit une feuille de route technique complète et hautement lisible.
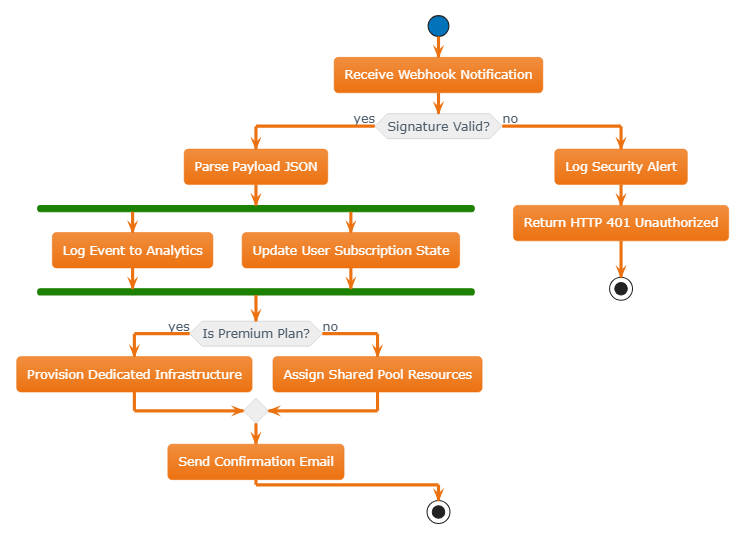
Voici le code source complet, prêt pour la production, que vous pouvez copier, coller et afficher instantanément :
@startuml
!theme aws-orange

start
:Recevoir une notification Webhook;
si (Signature Valide ?) alors (oui)
  :Analyser le JSON du payload;
  fork
    :Journaliser l'événement dans l'Analytics;
  fork again
    :Mettre à jour l'état d'abonnement de l'utilisateur;
  end fork
  si (Plan Premium ?) alors (oui)
    :Provisionner une infrastructure dédiée;
  sinon (non)
    :Attribuer des ressources d'un pool partagé;
  fin si
  :Envoyer un e-mail de confirmation;
sinon (non)
  :Journaliser une alerte de sécurité;
  :Retourner HTTP 401 Non autorisé;
  stop
fin si
stop

@endumlPourquoi créer des diagrammes avec VPasCode ?
Concevoir des flux de travail sous forme de code offre une approche rapide et axée sur le texte pour la documentation technique. Avec Visual Paradigm VPasCode, vous bénéficiez d’une boucle de rétroaction instantanée pour tous vos diagrammes :
- Détection automatique du format :Collez votre script PlantUML, Mermaid ou D2 directement dans l’éditeur sans avoir à configurer manuellement les sélecteurs de langage.
- Rendu en temps réel :Observez vos diagrammes visuels se mettre à jour instantanément, frappe par frappe, à mesure que vous affinerez votre logique.
- Options d’exportation flexibles :Téléchargez des graphiques vectoriels SVG nets et évolutifs ou des images PNG haute résolution pour vos présentations et vos wikis de documentation.
- Assistance propulsée par l’IA :Vous rencontrez un problème de syntaxe ? Cliquez sur « Corriger par l’IA » pour résoudre automatiquement les erreurs grâce à des comparaisons de code côte à côte transparentes.
Prêt à rationaliser votre documentation technique ?
Découvrez un rendu texte-diagramme ultra-rapide, une correction automatique des erreurs et un partage fluide, le tout gratuitement.
Related posts:
 Maîtriser la modélisation ArchiMate : Construire un système de gestion de bibliothèque avec PlantUML
 Comment appliquer un thème dans PlantUML
 Création d’une WBS de projet de construction professionnelle à l’aide de PlantUML et VPasCode
 Création d’un diagramme de cas d’utilisation professionnel pour la gestion d’entrepôt avec PlantUML et VPasCode