


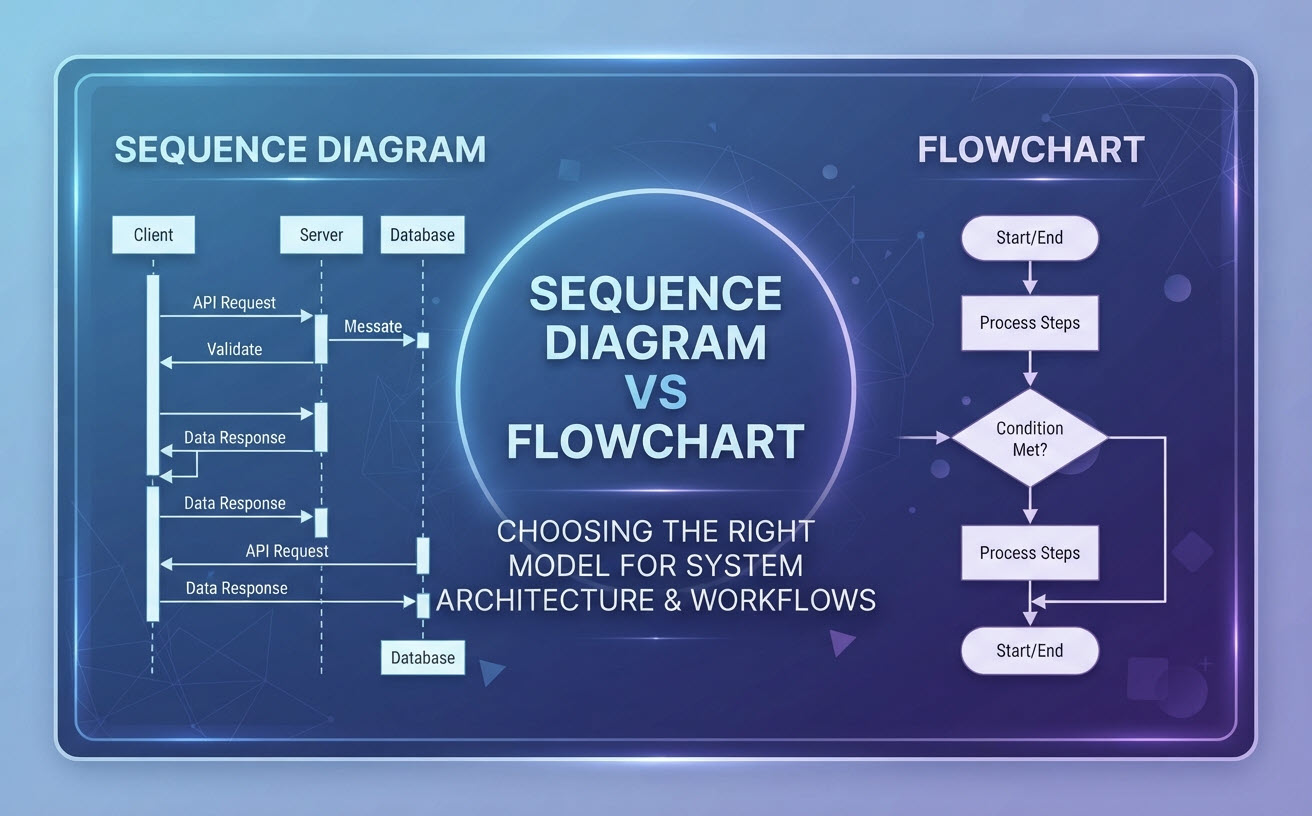
Escolher entre um diagrama de sequência e um fluxograma pode significar a diferença entre documentação de arquitetura cristalina e total confusão dos desenvolvedores. Embora ambas sejam ferramentas fundamentais de modelagem visual, elas resolvem problemas fundamentalmente diferentes. Um fluxograma mapeia a lógica procedural passo a passo, enquanto um diagrama de sequência visualiza como os componentes do sistema interagem ao longo de uma linha do tempo. Se você está procurando por umferramenta gratuita de Diagrama de Sequência ou omelhor editor de Diagrama de Sequência para otimizar seu fluxo de trabalho, entender quando implementar cada formato é o seu primeiro passo em direção a uma comunicação técnica mais clara.
1. A Diferença Central: Dinâmica Temporal vs. Caminhos Lógicos
Em um nível alto, a distinção central se resume adinâmica temporal versus lógica procedural:
- Diagramas de Sequência: Focam emtrocas de mensagens ordenadas no tempo entre entidades ativas (objetos, serviços ou atores).
- Fluxogramas: Focam emramificação condicional, progressão de estado e etapas algorítmicas dentro de um único processo.
1.1 O que é um Diagrama de Sequência? (Modelando Interações do Sistema ao Longo do Tempo)
Um diagrama de sequência é um diagrama de comportamento estrutural da Linguagem Unificada de Modelagem (UML) que ilustra como processos ou objetos interagem entre si e em que ordem. Ele representa linhas de vida que correm verticalmente e solicitações/respostas de mensagens que passam horizontalmente ao longo do tempo. São indispensáveis para sistemas distribuídos, arquiteturas de microsserviços e design do ciclo de vida de APIs.
Abaixo está um diagrama de sequência UML (Desenhado com PlantUML).
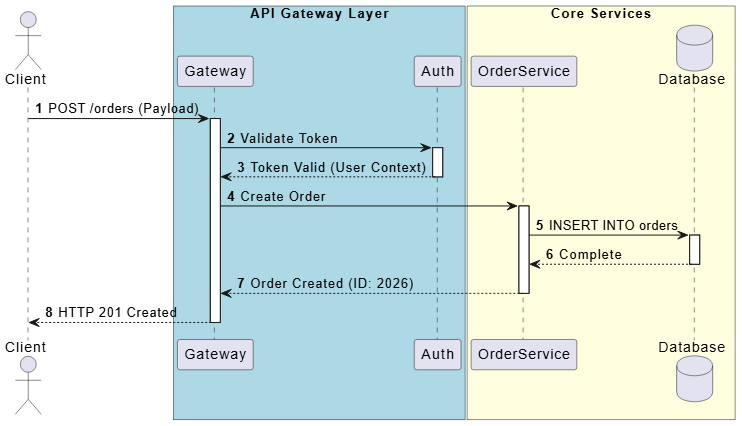
Código PlantUML correspondente:
@startuml

autonumber
actor Client
box "Camada de API Gateway" #LightBlue
participant Gateway
participant Auth
end box
box "Serviços Core" #LightYellow
participant OrderService
database Database
end box

Client -> Gateway : POST /orders (Payload)
activate Gateway
Gateway -> Auth : Validar Token
activate Auth
Auth --> Gateway : Token Válido (Contexto do Usuário)
deactivate Auth

Gateway -> OrderService : Criar Pedido
activate OrderService
OrderService -> Database : INSERT INTO orders
activate Database
Database --> OrderService : Concluído
deactivate Database
OrderService --> Gateway : Pedido Criado (ID: 2026)
deactivate OrderService
Gateway --> Client : HTTP 201 Created
deactivate Gateway

@enduml1.2 O que é um Fluxograma? (Mapeando Lógica Procedural e Árvores de Decisão)
Um fluxograma é uma representação diagramática de um algoritmo, fluxo de trabalho ou processo passo a passo.Usando formas geométricas padrão conectadas por setas direcionais, os fluxogramas mapeiam nós de decisão, pontos de entrada/saída e ações sequenciais. Eles se destacam ao explicar fluxos de trabalho operacionais para partes interessadas não técnicas.
Abaixo está um fluxograma (desenhado com Mermaid):
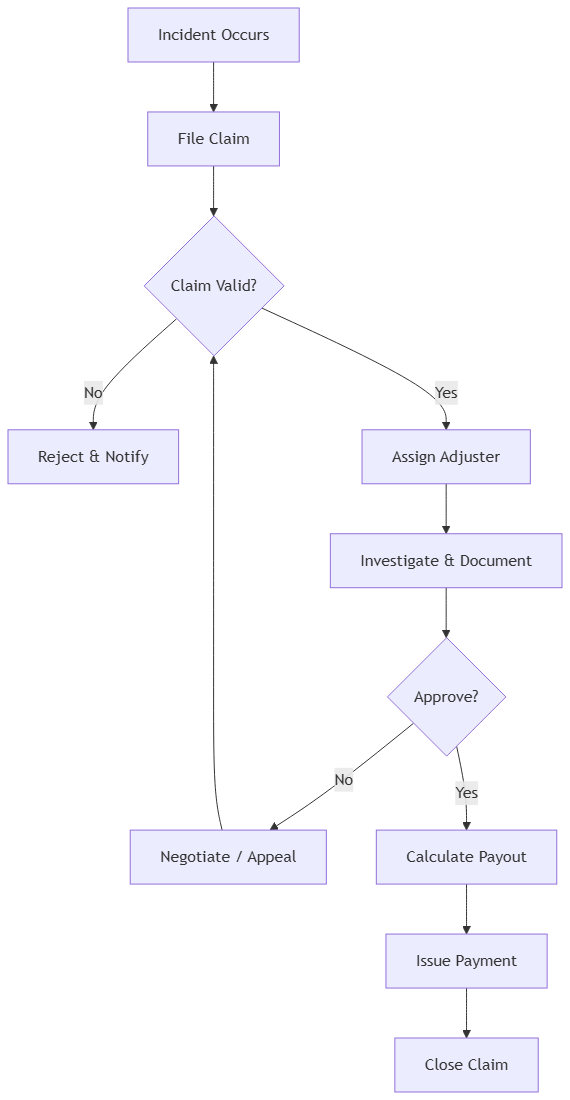
Código Mermaid correspondente:
flowchart TD
    A[Incidente Ocorre] --> B[Registrar Reclamação]
    B --> C{Reclamação Válida?}
    C -->|Não| D[Rejeitar & Notificar]
    C -->|Sim| E[Atribuir Perito]
    E --> F[Investigar & Documentar]
    F --> G{Aprovar?}
    G -->|Não| H[Negociar / Recorrer]
    H --> C
    G -->|Sim| I[Calcular Indenização]
    I --> J[Emitir Pagamento]
    J --> K[Encerrar Reclamação]
2. Comparação Arquitetural Lado a Lado
Para avaliar rapidamente qual modelo se adequa à sua tarefa técnica atual, considere as diferenças estruturais diretas:
| Vetor de Comparação | Diagrama de Sequência | Fluxograma |
|---|---|---|
| Dimensão Principal | Tempo cronológico (execução de cima para baixo) | Lógica e Ramificação (fluxo do processo) |
| Elementos Principais | Linhas de Vida, Barras de Ativação, Mensagens Síncronas/Assíncronas | Oval de Início/Fim, Losangos de Decisão, Retângulos de Ação |
| Escopo do Sistema | Interações entre múltiplos componentes (Serviço A para Serviço B) | Execução de processo único ou lógica de jornada do usuário |
| Público Principal | Arquitetos de Software, Desenvolvedores Backend, Designers de API | Gerentes de Produto, Analistas de Negócios, Equipes Multifuncionais |
2.1 Detalhamento de Elementos: Linhas de Vida vs. Nós de Decisão
Em um diagrama de sequência, as linhas verticais representam a vida útil dos participantes ativos do sistema. As setas horizontais mostram a comunicação (por exemplo, solicitações HTTP POST ou chamadas gRPC) entre as linhas de vida. Em contraste, os fluxogramas dependem de losangos de decisão (por exemplo, “O usuário está autenticado?”) que dividem a execução em ramificações independentes, independentemente de qual sistema as executa.
2.2 Alinhamento com o Público-Alvo: Engenheiros vs. Partes Interessadas Multifuncionais
Os fluxogramas são acessíveis a quase qualquer pessoa — desde executivos de negócios até líderes de suporte ao cliente. Os diagramas de sequência exigem familiaridade com conceitos orientados a objetos ou distribuídos, tornando-os ideais para transferências de engenharia precisas, onde condições de corrida, tempos limite e expectativas de carga devem ser detalhadas explicitamente.
3. Estrutura de Decisão: Quando Usar Cada Diagrama
3.1 Escolha um Diagrama de Sequência Para: Chamadas de API, Microsserviços e Fluxos de Autenticação
Implante diagramas de sequência quando o tempo dos componentes e a sequência das mensagens forem críticos para a saúde do sistema. Casos de uso típicos incluem:
- Apertos de mão de autenticação OAuth2 / JWT entre Cliente, Servidor e Provedor de Identidade.
- Filas de mensagens assíncronas orientadas a eventos (Kafka, RabbitMQ).
- Transações de checkout de comércio eletrônico envolvendo gateways de pagamento e serviços de inventário.
3.2 Escolha um Fluxograma Para: Processos de Negócio, Lógica Algorítmica e Loops de Integração
Implante fluxogramas quando seu objetivo principal for mapear lógica condicional ou caminhos operacionais. Casos de uso típicos incluem:
- Documentar sequências de integração de usuários e lógica de e-mail de fallback.
- Projetar algoritmos de ordenação de backend ou pipelines de transformação de dados.
- Procedimentos Operacionais Padrão (SOPs) para mesas de serviço de TI.
3.3 O Cenário Híbrido: Quando Sua Arquitetura Exige Ambos
Documentação técnica complexa frequentemente exige ambos os formatos. Por exemplo, você pode usar um fluxograma para definir a lógica de negócios de um mecanismo automatizado de processamento de reivindicações e, em seguida, complementá-lo com um diagrama de sequência mostrando as chamadas de API de microsserviços que executam a reivindicação aprovada.
4. Fluxos de Trabalho Modernos de Diagramação: Transição para Diagrama como Código
4.1 Por Que DSLs de Texto para Diagrama (PlantUML & Mermaid) Superam o Desenho Manual
Ferramentas de desenho manual de arrastar e soltar frequentemente atrasam as equipes com alinhamento de pixels, formatação de tela e arquivos de exportação desatualizados. Equipes de software modernas estão migrando para Diagrama como Código usando Linguagens Específicas de Domínio (DSLs) como PlantUML e Mermaid. Escrever código baseado em texto permite que os diagramas sejam versionados no Git junto com o código-fonte da aplicação.
4.2 Simplificando a Sintaxe de Diagramas de Sequência e Fluxograma com Visual Paradigm VPasCode
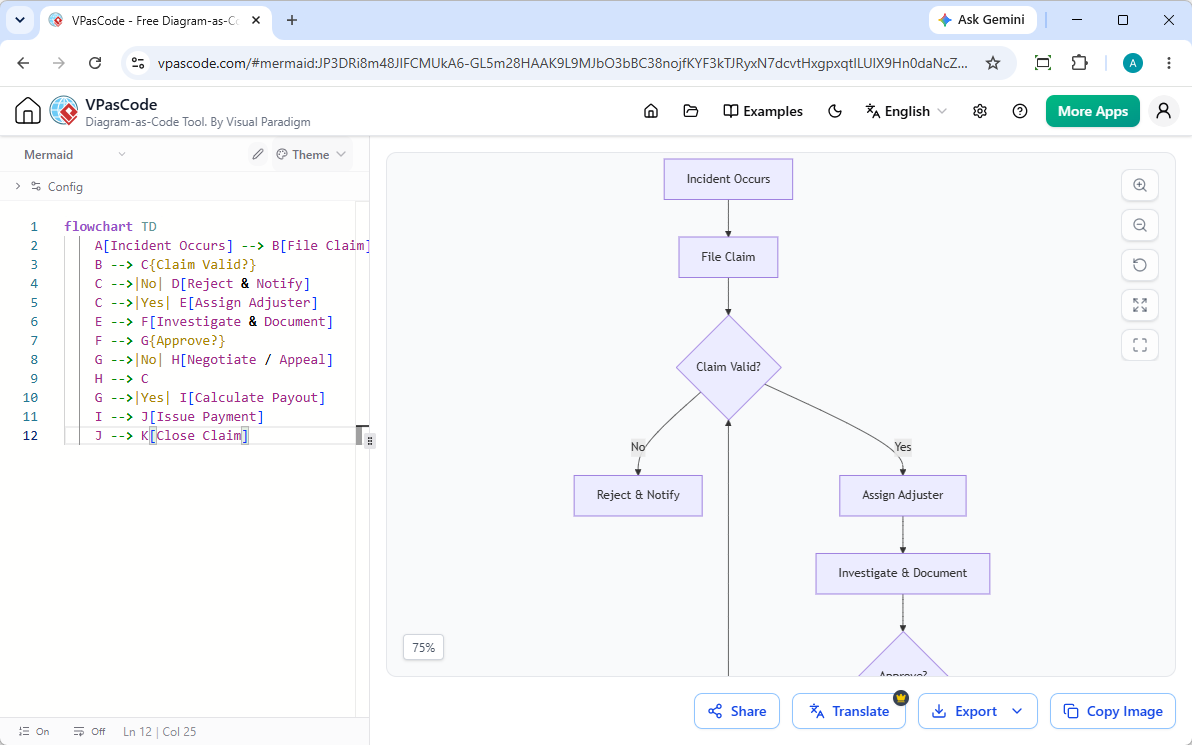
Se você está procurando por uma ferramenta confiável, ferramenta gratuita de Diagrama de Sequência ou a melhor editor de Diagrama de Sequência online, Visual Paradigm VPasCode oferece uma experiência simplificada:
- Detecção Automática de Formato: Cole scripts brutos de PlantUML, Mermaid, D2 ou Graphviz no editor—VPasCode reconhece instantaneamente o formato e renderiza o diagrama visual sem configuração manual.
- Visualização ao Vivo em Tempo Real: Visualize as atualizações lado a lado enquanto digita seu código.
- Exportações Flexíveis de Alta Resolução:Exporte vetores SVG limpos ou PNGs de alta resolução para documentação, páginas Wiki ou integrações com OpenDocs.
4.3 Tradução automática por IA e correção de erros para equipes de tecnologia globais
O VPasCode reduz o atrito na manutenção de código com capacidades de IA integradas:
- Correção por IA:Diagnostique e resolva instantaneamente erros de sintaxe em scripts PlantUML ou Mermaid com explicações detalhadas de diff.
- Tradução nativa de diagramas por IA:Traduza instantaneamente rótulos de diagramas para vários idiomas para apoiar equipes de desenvolvimento internacionais.
5. Lista de verificação resumida: Como decidir em menos de 30 segundos
Regra prática rápida:
• Pergunte:“Estou descrevendo interações temporais entre diferentes serviços/objetos?” → Use um Diagrama de Sequência.
• Pergunte:“Estou descrevendo um caminho de decisão passo a passo ou lógica de negócios?” → Use um Fluxograma.
Experimente o VPasCode agora em: https://www.vpascode.com/editor/
Related posts:
 O Guia Definitivo de Editores PlantUML: Funcionalidades, Opções e Soluções Modernas Baseadas em Código
 O PlantUML pode desenhar Diagramas Entidade-Relacionamento (DER)? Guia Completo & Ferramenta Gratuita
 Diagramas UML são apenas para POO? Mitos vs. Usos Modernos
 A IA pode criar diagramas UML? Como os engenheiros modernos automatizam a arquitetura de sistemas