


When reviewing tabular data, financial exports, or system metrics, reading plain comma-separated text can make it difficult to visualize how records relate to column headers. The CSV Visualizer transforms tabular CSV datasets into clear, interactive tree-structured node graphs. By mapping header rows as parent field declarations and data rows into structured record branches, analysts and developers can quickly audit data alignment, inspect field values, and present flat tables as interactive diagrams.
The Mechanics of CSV Visualizations
In VPasCode, CSV rendering parses the first row as the header schema and each subsequent row as an individual record object. Column names branch out as field labels, values map directly into leaf nodes, and rows stack into an organized visual tree map for easy scanning.
1. Essential Setup
To visualize a standard CSV file, define a comma-separated header row followed by data rows. Core operational tables like sales summaries demonstrate standard record mapping:
OrderId,Region,Representative,TotalSales,Status
ORD-101,North,Alice Smith,4500.00,Completed
ORD-102,South,Bob Jones,1250.50,Pending
ORD-103,West,Carol White,3200.00,Completed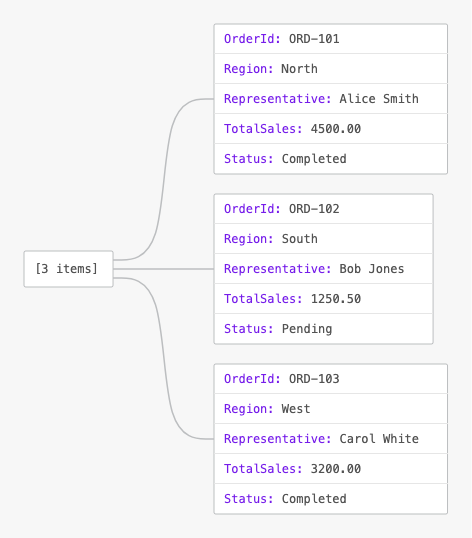
Advanced Structural Techniques
CSV visualizations excel at converting flat user directories, system permissions, and account lists into interactive node trees.
1. User Directory List
By organizing user profiles into comma-separated rows, VPasCode transforms flat contact sheets into distinct user nodes with mapped attribute fields:
UserId,Name,Email,Role,Active
usr_01,Jane Doe,[email protected],Admin,true
usr_02,Alex Wong,[email protected],Developer,true
usr_03,Sarah Miller,[email protected],Viewer,false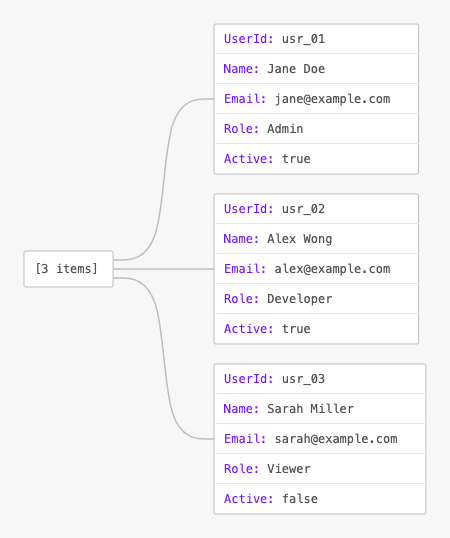
Structuring Environmental Data and Time Series
Visualizing time-series telemetry or weather observations helps analysts inspect multi-metric recordings across different stations without getting lost in row grids.
1. Weather Station Observations
Group timestamps, locations, and sensor readings into defined columns for clear visual trend inspection:
StationId,Timestamp,TempCelsius,HumidityPct,WindSpeedKmh
ST-01,2026-07-28T12:00:00Z,24.5,60,12.8
ST-01,2026-07-28T13:00:00Z,26.1,55,14.2
ST-02,2026-07-28T12:00:00Z,18.3,82,8.5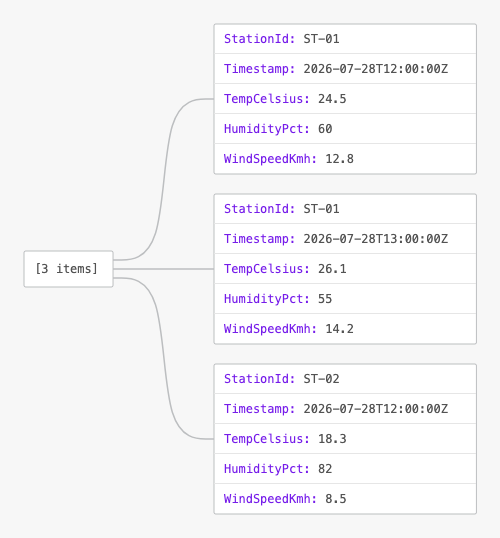
Strategic Best Practices
- Include an Explicit Header Row: Always reserve the first row for column names so the visualizer can assign meaningful key labels to record nodes.
- Quote Fields Containing Commas: Wrap values in double quotes (e.g.,
"Smith, John") if a single field value contains internal commas or line breaks. - Maintain Consistent Column Counts: Ensure every data row has the exact same number of commas as the header row to prevent column shifting and misaligned visual trees.