


Al modelar sistemas de software, el Diagrama de Clases es el diagrama UML estático más utilizado, mientras que el Diagrama de Secuencia es el diagrama UML dinámico más utilizado.Juntos, estos dos diagramas representan la gran mayoría del uso del Lenguaje de Modelado Unificado (UML) en la ingeniería de software moderna, proporcionando la base fundamental para la arquitectura estructural y los flujos de procesos conductuales.
Aunque UML define 14 tipos oficiales de diagramas, los equipos de ingeniería rara vez utilizan todos ellos. En cambio, los flujos de trabajo de desarrollo modernos se centran en gran medida en un pequeño subconjunto de diagramas clave para comunicar decisiones de diseño rápidamente, especialmente cuando se combinan con Diagramas como Código herramientas como un editor de PlantUML o un visor en vivo de Mermaid.

La respuesta directa: Los diagramas de clases y los diagramas de secuencia lideran el grupo
Los diagramas UML se dividen ampliamente en dos categorías: Diagramas Estructurales (que muestran la organización estática del código) y Diagramas Conductuales (que muestran cómo fluyen los datos y la ejecución a lo largo del tiempo). En ambas categorías, un único diagrama destaca como el estándar dominante.
Diagramas de Clases: El estándar de oro estructural para el diseño orientado a objetos
Un Diagrama de Clases es un diagrama UML estructural estático que describe las clases, atributos, operaciones y relaciones dentro de un sistema orientado a objetos.Sirve como el plano visual directo de las estructuras de código del backend.
- Por qué es tan común: Los diagramas de clases se mapean casi 1:1 con lenguajes de programación orientada a objetos (POO) como Java, TypeScript, C# y Python.
- Casos de uso principales: Planificación de esquemas de bases de datos, modelado de dominios de objetos y refactorización de bases de código monolíticas.
Diagramas de Secuencia: El líder dinámico para el flujo de procesos y APIs
Un Diagrama de Secuencia es un diagrama UML conductual dinámico que ilustra cómo los objetos o servicios interactúan entre sí en un orden temporal secuencial. Mapea visualmente los intercambios de mensajes entre actores y componentes a lo largo del tiempo.
- Por qué es tan común: Los diagramas de secuencia son esenciales para arquitecturas distribuidas modernas, como APIs REST, microservicios y flujos de autenticación OAuth.
- Casos de uso principales: Mapeo de ciclos de vida de solicitudes y respuestas de API, depuración de flujos de trabajo de múltiples servicios y diseño de sistemas impulsados por eventos.
Más allá del ganador: Los 5 mejores diagramas UML utilizados en la ingeniería de software del mundo real
Aunque los diagramas de clases y de secuencia se llevan los honores principales, los desarrolladores y arquitectos frecuentemente dependen de tres tipos adicionales de diagramas para cubrir necesidades de ingeniería específicas.
| Diagrama UML | Categoría | Enfoque principal | Mejor utilizado para |
|---|---|---|---|
| Diagrama de clases | Estructural | Estructura estática del código | Modelos de datos, jerarquías de clases de backend, diseño de POO |
| Diagrama de secuencia | Comportamental | Interacciones ordenadas por tiempo | Llamadas a API, mensajería de microservicios, flujos de autenticación |
| Diagrama de casos de uso | Comportamental | Requisitos del sistema | Mapeo de roles de usuario e interacciones de alto nivel |
| Diagrama de actividades | Comportamental | Lógica de flujo de trabajo procedural | Lógica algorítmica, procesos empresariales complejos |
| Componente / Despliegue | Estructural | Infraestructura y sistemas | Topología en la nube, configuraciones de Docker/Kubernetes, CI/CD |
Diagramas de casos de uso: Alinear equipos técnicos con los requisitos empresariales
Los diagramas de casos de uso capturan lo que un sistema debe hacer desde la perspectiva del usuario final. Definen actores (usuarios, sistemas externos) y sus interacciones con los límites del sistema sin profundizar en los detalles de implementación del código.
Diagramas de actividades: Mapeo de flujos de trabajo complejos y lógica algorítmica
Piense en los diagramas de actividades como diagramas de flujo avanzados y estandarizados. Detallan la lógica empresarial de múltiples pasos, ramas de decisión y ejecuciones paralelas; ideales para documentar algoritmos complejos de backend.
Diagramas de componentes y despliegue: Visualización de arquitecturas en la nube e infraestructura
Los diagramas de despliegue y componentes mapean nodos físicos, artefactos de microservicios y topología en la nube. Ofrecen a los ingenieros DevOps y arquitectos de sistemas una visión clara de cómo se alojan y despliegan los componentes de software en los servidores.
Por qué los equipos de ingeniería modernos están pasando del arrastrar y soltar al diagrama como código
Históricamente, crear diagramas UML requería software de escritorio pesado o editores de lienzo de arrastrar y soltar engorrosos. Los equipos de software de hoy, que se mueven rápidamente, están cambiando hacia un “”Diagramas como Código” enfoque utilizando lenguajes específicos de dominio (DSL) como PlantUML y Mermaid.
Los cuellos de botella de las herramientas tradicionales de dibujo de arrastrar y soltar
- Fricción de alineación:Dedicar más tiempo a revisar píxel por píxel las líneas y la alineación de los cuadros que a diseñar la lógica del sistema.
- Documentación desactualizada:Los diagramas de lienzo se almacenan como imágenes binarias o archivos de proyecto propietarios, volviéndose obsoletos rápidamente porque editarlos requiere actualizaciones manuales.
- Incompatibilidad con Git:Los archivos de lienzo visual no pueden controlarse fácilmente por versiones, compararse mediante diff ni revisarse en solicitudes de extracción (pull requests) estándar de Git.
Cómo los diagramas como código aceleran la documentación y el control de versiones
Con los diagramas como código, los diagramas se escriben en una sintaxis de texto simple y legible por humanos (por ejemplo, PlantUML, Mermaid o D2). Esto ofrece grandes beneficios de productividad:
- Nativo para Git:Almacena tus archivos fuente de diagramas junto con el código de tu aplicación en repositorios.
- Diseño automático:El motor de renderizado se encarga automáticamente de la posición, el espaciado y el enrutamiento.
- Actualizaciones instantáneas:Actualizar un flujo de secuencia complejo es tan rápido como cambiar unas pocas líneas de código.
Cómo renderizar y generar diagramas UML en segundos con VPasCode e IA
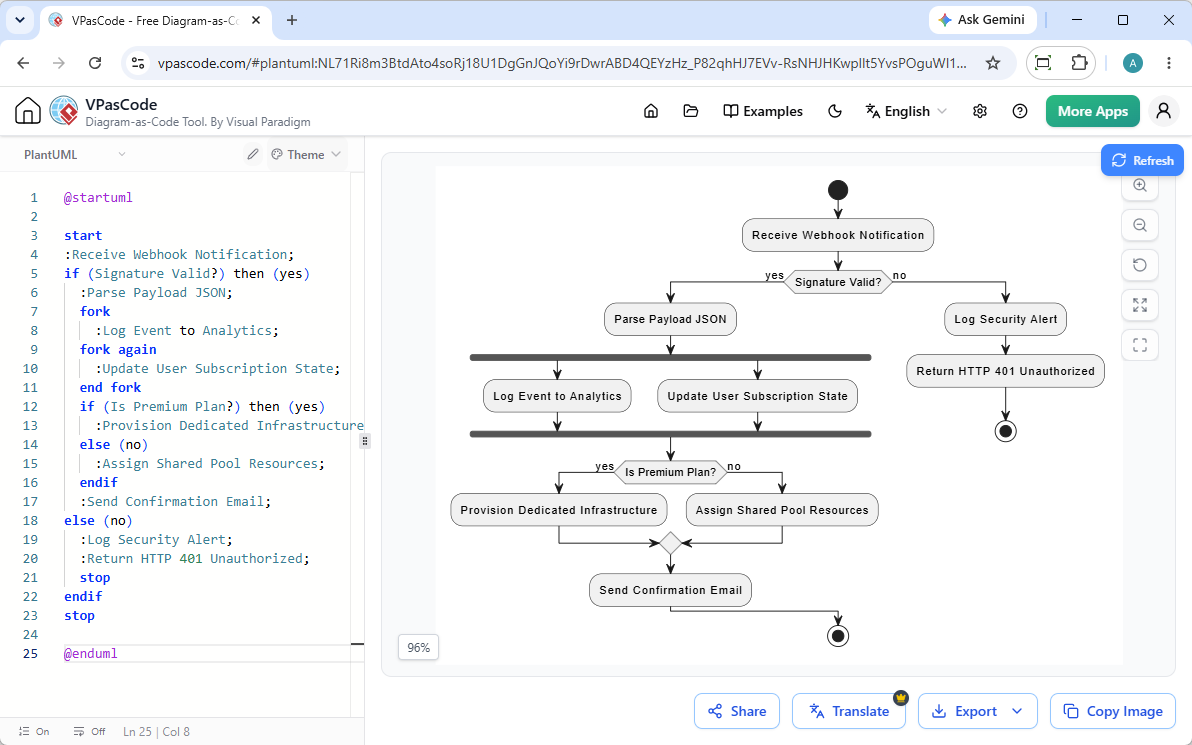
Si quieres la velocidad de los diagramas como código sin el fastidio de configurar entornos locales o usar herramientas CLI complejas,Visual Paradigm VPasCodeofrece una solución instantánea y basada en web diseñada específicamente para desarrolladores.
Generación y modificación instantánea de diagramas con IA
Como se destaca en nuestro Gran actualización de VPasCode: Generar y modificar diagramas instantáneamente con IA, puedes omitir por completo la codificación manual ingresando indicaciones en lenguaje natural, como “Generar un diagrama de clases en PlantUML para un sistema de comercio electrónico”—lo que te permite crear y refactorizar diagramos nativamente dentro del editor en segundos.
Formato instantáneo con detección automática de DSL y vista previa en tiempo real
VPasCode cuenta con detección automática inteligente en docenas de formatos, incluidos PlantUML, Mermaid, Graphviz y D2. Simplemente pega tu código sin procesar o ingresa tu solicitud en el editor del navegador, y la herramienta identifica instantáneamente la sintaxis y actualiza el diagrama renderizado en tiempo real mientras escribes.
Corregir errores de sintaxis sin esfuerzo mediante diagnósticos impulsados por IA y diferencias de código
Aprender la sintaxis de un nuevo DSL de diagramas puede provocar errores de sintaxis ocasionales. VPasCode acelera tu ciclo de retroalimentación con un botón dedicado“Corregir con IA” botón. Cuando el código falla, la IA integrada repara el script automáticamente y presenta una diferencia de código transparente lado a lado para que puedas aprender la sintaxis correcta sobre la marcha.
Integrar diagramas en especificaciones técnicas de producción con OpenDocs
Una vez que tu diagrama se ha renderizado, VPasCode facilita la exportación. Puedes descargar imágenes vectoriales SVG o PNG de alta resolución, compartir enlaces interactivos o enviar diagramas directamente aVisual Paradigm OpenDocs para construir especificaciones técnicas integrales y documentación de ingeniería.
(Nota: Las funciones avanzadas de generación de diagramas con IA, modificación de código y corrección de errores están disponibles en Visual Paradigm Online Deluxe Edition / Visual Paradigm Desktop Professional Edition+).
Cómo elegir el diagrama UML adecuado para tu tarea inmediata
Para elegir el diagrama adecuado para tu tarea, identifica tu objetivo principal:
- ¿Construir una base de datos o mapear clases de POO? Comienza con unDiagrama de Clases.
- ¿Mapear un punto final de API, interacción de microservicio o flujo de autenticación? Crea unDiagrama de Secuencia.
- ¿Explicar pasos de flujo de trabajo o decisiones de lógica de negocio? Usa unDiagrama de Actividad.
- ¿Presentar capacidades del sistema a las partes interesadas? Dibuja unDiagrama de Casos de Uso.
Preguntas frecuentes sobre diagramación UML
¿Sigue siendo relevante UML en el desarrollo de software moderno?
Sí. Aunque la generación de código a partir de modelos completos ha disminuido, el UML ligero, especialmente los diagramas de Clases y Secuencia escritos como código, sigue siendo el estándar de la industria para revisiones de arquitectura, especificaciones técnicas y la incorporación de nuevos miembros al equipo.
¿Cuál es la forma más fácil de empezar a dibujar diagramas UML?
La forma más rápida es utilizar una herramienta de Diagramas como Código basada en navegador como VPasCode. Escribir scripts de texto plano o generar modelos utilizando indicaciones de IA en lenguaje natural elimina el trabajo manual de alineación y le permite generar diagramas limpios al instante.
¿Cuál es la diferencia entre un Diagrama de Clases y un Diagrama de Secuencia?
Un Diagrama de Clases es estático y muestra la estructura del sistema (clases, campos y relaciones). Un Diagrama de Secuencia es dinámico y muestra la lógica de comportamiento a lo largo del tiempo (cómo los componentes se envían mensajes entre sí).
Related posts:
 La guía definitiva de editores PlantUML: características, opciones y soluciones modernas impulsadas por código
 ¿Puede PlantUML dibujar diagramas ERD? Guía completa y herramienta gratuita
 ¿Es PlantUML gratuito? La guía completa sobre costos, licencias de código abierto y alternativas alojadas
 ¿Puede la IA crear diagramas UML? Cómo los ingenieros modernos automatizan la arquitectura del sistema