


При моделировании программных систем диаграмма классов является наиболее часто используемой статической диаграммой UML, в то время как диаграмма последовательностей — наиболее часто используемой динамической диаграммой UML.Вместе эти две диаграммы составляют подавляющее большинство использования языка унифицированного моделирования (UML) в современной разработке программного обеспечения, обеспечивая основу для структурной архитектуры и потоков поведенческих процессов.
Хотя UML определяет 14 официальных типов диаграмм, инженерные команды редко используют все их. Вместо этого современные рабочие процессы разработки сосредоточены на небольшом подмножестве основных диаграмм для быстрой передачи проектных решений — особенно в сочетании с современными диаграммами как кодоминструментами, такими как редактор PlantUML или живой предпросмотр Mermaid.

Прямой ответ: диаграммы классов и диаграммы последовательностей лидируют
Диаграммы UML в целом делятся на две категории: Структурные диаграммы (которые показывают статическую организацию кода) и Поведенческие диаграммы (которые показывают, как данные и выполнение протекают во времени). В обеих категориях одна диаграмма выделяется как доминирующий стандарт.
Диаграммы классов: золотой стандарт структурного объектно-ориентированного проектирования
Диаграмма классов — это статическая структурная диаграмма UML, описывающая классы, атрибуты, операции и отношения внутри объектно-ориентированной системы.Она служит прямым визуальным чертежом структур бэкенд-кода.
- Почему она так распространена:Диаграммы классов почти полностью соответствуют языкам объектно-ориентированного программирования (ООП), таким как Java, TypeScript, C# и Python.
- Основные случаи использования:Планирование схем баз данных, моделирование предметных областей объектов и рефакторинг монолитных кодовых баз.
Диаграммы последовательностей: динамический лидер для процессов и потоков API
Диаграмма последовательностей — это динамическая поведенческая диаграмма UML, которая иллюстрирует, как объекты или сервисы взаимодействуют друг с другом в последовательном временном порядке.Она визуально отображает обмен сообщениями между акторами и компонентами во времени.
- Почему она так распространена:Диаграммы последовательностей необходимы для современных распределенных архитектур, таких как REST API, микросервисы и потоки аутентификации OAuth.
- Основные случаи использования:Составление карт жизненных циклов запросов-ответов API, отладка многокомпонентных рабочих процессов и проектирование событийно-ориентированных систем.
За пределами победителя: топ-5 диаграмм UML, используемых в реальной разработке программного обеспечения
Хотя диаграммы классов и последовательностей занимают первые места, разработчики и архитекторы часто опираются на три дополнительных типа диаграмм для покрытия конкретных инженерных потребностей.
| Диаграмма UML | Категория | Основной фокус | Лучше всего подходит для |
|---|---|---|---|
| Диаграмма классов | Структурная | Статическая структура кода | Модели данных, иерархии классов бэкенда, проектирование ООП |
| Диаграмма последовательности | Поведенческая | Временные взаимодействия | Вызовы API, обмен сообщениями микросервисов, потоки аутентификации |
| Диаграмма вариантов использования | Поведенческая | Требования к системе | Отображение ролей пользователей и высокоуровневых взаимодействий |
| Диаграмма деятельности | Поведенческая | Логика процедурного рабочего процесса | Алгоритмическая логика, сложные бизнес-процессы |
| Компонентная / Развёртывание | Структурная | Инфраструктура и системы | Топология облака, настройки Docker/Kubernetes, CI/CD |
Диаграммы вариантов использования: согласование технических команд с бизнес-требованиями
Диаграммы вариантов использования фиксируют, что система должна делать с точки зрения конечного пользователя. Они определяют акторов (пользователей, внешние системы) и их взаимодействия с границами системы, не углубляясь в детали реализации кода.
Диаграммы деятельности: отображение сложных рабочих процессов и алгоритмической логики
Рассматривайте диаграммы деятельности как продвинутые стандартизированные блок-схемы. Они детализируют многошаговую бизнес-логику, ветвления решений и параллельные выполнения — идеально подходят для документирования сложных алгоритмов бэкенда.
Диаграммы компонентов и развёртывания: визуализация облачных и инфраструктурных архитектур
Диаграммы развёртывания и компонентов отображают физические узлы, артефакты микросервисов и топологию облака. Они дают инженерам DevOps и архитекторам систем чёткое представление о том, как компоненты программного обеспечения размещаются и развёртываются на серверах.
Почему современные инженерные команды переходят от перетаскивания к диаграммам как коду
Исторически создание диаграмм UML требовало громоздкого настольного программного обеспечения или неуклюжих редакторов с перетаскиванием на холсте. Современные быстродействующие команды разработчиков переходят к подходу «диаграммы как код», используя предметно-ориентированные языки (DSL), такие как PlantUML и Mermaid.
Узкие места традиционных инструментов рисования с перетаскиванием
- Трудности с выравниванием:Тратится больше времени на подгонку линий и выравнивание блоков по пикселям, чем на проектирование логики системы.
- Устаревшая документация:Диаграммы на холсте хранятся в виде бинарных изображений или проприетарных файлов проектов, что быстро приводит к их устареванию, поскольку их редактирование требует ручных обновлений.
- Несовместимость с Git:Файлы визуальных холстов невозможно легко версионировать, сравнивать (diff) или рецензировать в стандартных pull-запросах Git.
Как подход «диаграммы как код» ускоряет документирование и контроль версий
При подходе «диаграммы как код» диаграммы пишутся на простом, понятном человеку текстовом синтаксисе (например, PlantUML, Mermaid или D2). Это даёт значительные преимущества в производительности:
- Нативная работа с Git:Храните исходные файлы диаграмм вместе с кодом приложения в репозиториях.
- Автоматическая компоновка:Движок рендеринга автоматически управляет позиционированием, отступами и маршрутизацией.
- Мгновенные обновления:Обновление сложного потока последовательности так же быстро, как изменение нескольких строк кода.
Как рендерить и генерировать диаграммы UML за секунды с помощью VPasCode и ИИ
Если вы хотите получить скорость работы с подходом «диаграммы как код» без хлопот, связанных с настройкой локальной среды или сложными CLI-инструментами, Visual Paradigm VPasCodeпредлагает мгновенное веб-решение, созданное специально для разработчиков.
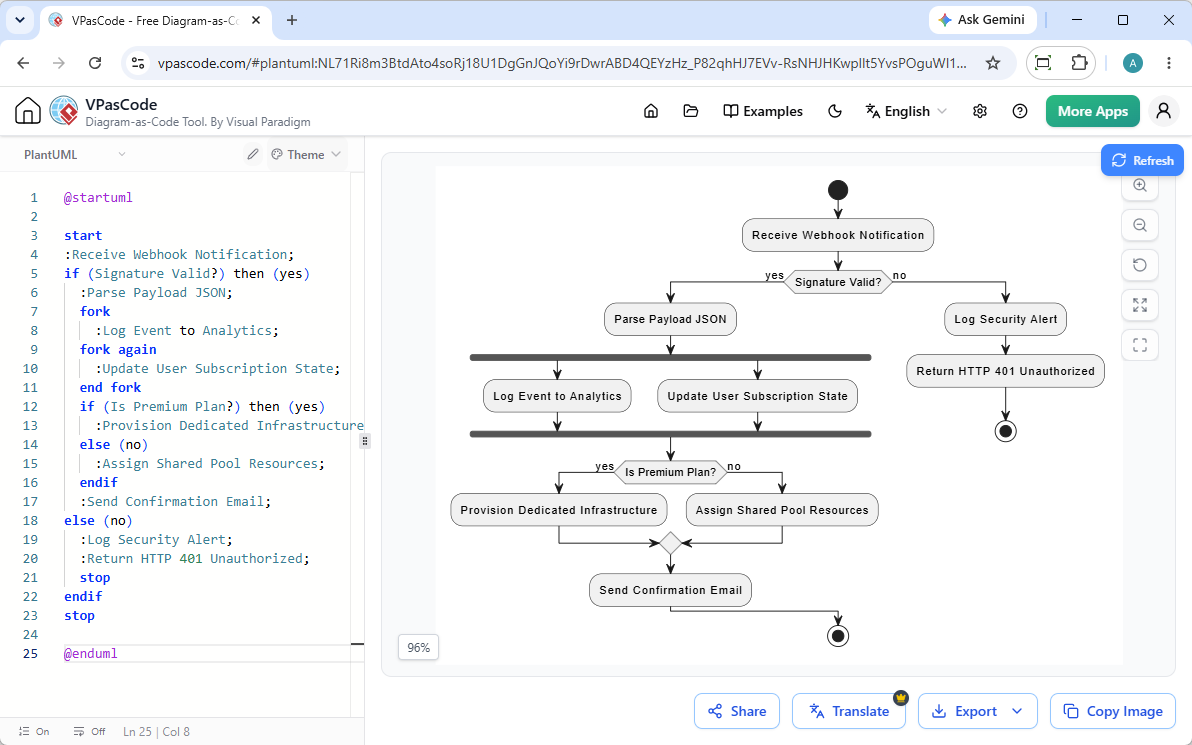
Мгновенная генерация и модификация диаграмм с помощью ИИ
Как отмечено в нашей Крупное обновление VPasCode: мгновенная генерация и модификация диаграмм с помощью ИИ, вы можете полностью обойтись без ручного написания кода, вводя запросы на естественном языке — например, «Сгенерируйте диаграмму классов в PlantUML для системы электронной коммерции»—что позволяет вам создавать и рефакторить диаграммы непосредственно внутри редактора за секунды.
Мгновенное форматирование с автоматическим определением DSL и предпросмотром в реальном времени
VPasCode обладает интеллектуальным автоматическим определением форматов, включая PlantUML, Mermaid, Graphviz и D2. Просто вставьте свой исходный код или введите запрос в редактор браузера, и инструмент мгновенно определит синтаксис и обновит рендеринг диаграммы в реальном времени по мере ввода.
Беспрепятственное исправление синтаксических ошибок с помощью диагностики на базе ИИ и сравнения кода
Изучение нового синтаксиса DSL для диаграмм может иногда приводить к синтаксическим ошибкам. VPasCode ускоряет ваш цикл обратной связи благодаря выделенной«Исправить с помощью ИИ»кнопке. Когда код ломается, встроенный ИИ автоматически исправляет скрипт и показывает прозрачное сравнение кода в виде двух столбцов, чтобы вы могли мгновенно усвоить правильный синтаксис.
Интеграция диаграмм в производственные технические спецификации с помощью OpenDocs
Как только ваша диаграмма отрисована, VPasCode делает экспорт простым. Вы можете загрузить векторные изображения высокого разрешения в форматах SVG или PNG, поделиться интерактивными ссылками или отправить диаграммы напрямую вVisual Paradigm OpenDocsдля создания комплексных технических спецификаций и инженерной документации.
(Примечание: Расширенные функции генерации диаграмм с помощью ИИ, модификации кода и исправления ошибок доступны в Visual Paradigm Online Deluxe Edition / Visual Paradigm Desktop Professional Edition+).
Как выбрать подходящую диаграмму UML для вашей текущей задачи
Чтобы выбрать правильную диаграмму для вашей задачи, определите свою основную цель:
- Создание базы данных или отображение классов ООП? Начните сдиаграммы классов.
- Отображение конечной точки API, взаимодействия микросервисов или потока авторизации? Создайтедиаграмму последовательности.
- Объяснение шагов рабочего процесса или решений бизнес-логики? Используйтедиаграмму деятельности.
- Представление возможностей системы заинтересованным сторонам? Нарисуйтедиаграмму вариантов использования.
Часто задаваемые вопросы о диаграммировании UML
Актуален ли UML в современной разработке программного обеспечения?
Да. Хотя генерация кода на основе полной модели сократилась, лёгкий UML — особенно диаграммы классов и последовательности, записанные в виде кода — остаётся отраслевым стандартом для обзоров архитектуры, технических спецификаций и ввода в команду.
Какой самый простой способ начать рисовать диаграммы UML?
Самый быстрый способ — использовать браузерный инструмент «Диаграмма как код», такой какVPasCode. Написание текстовых скриптов или генерация моделей с помощью промптов на естественном языке с использованием ИИ устраняет необходимость в ручной настройке и позволяет мгновенно создавать чистые диаграммы.
В чём разница между диаграммой классов и диаграммой последовательности?
Диаграмма классов — этостатическая и отображает структуру системы (классы, поля и связи). Диаграмма последовательности — этодинамическая и отображает поведенческую логику во времени (как компоненты обмениваются сообщениями).
Related posts:
 Подходит ли PlantUML для сложных диаграмм? Масштабирование архитектуры и управление крупными кодовыми базами
 Может ли PlantUML создавать интеллект-карты? Полное руководство по синтаксису и подходу «диаграмма как код»
 Что лучше PlantUML? Топ альтернатив и улучшений для диаграмм как кода
 Устарел ли PlantUML? Правда о диаграммах как коде в 2026 году