Creating clear diagrams used to mean spending hours clicking, dragging shapes, and struggling to align arrows in heavy visual design software. If a single step in your workflow changed, you often had to rebuild the entire chart from scratch. Today, modern teams are moving away from manual drawing and adopting a faster, cleaner approach: turn plain written script directly into visual graphics using a text to diagram tool.
Whether you need to map out a system process, sketch a software architecture, or visualize a complex database, taking advantage of a text to diagram tool allows you to create professional visuals in seconds just by typing simple lines of text. In this guide, we will break down everything you need to know about diagramming with code, why it revolutionizes documentation, and how you can get started today for free.

What is Diagramming with Text?
Diagramming with text—frequently referred to as “diagrams-as-code”—is a method where you write structured plain text or code statements to define shapes, relationships, and flows. Instead of manually positioning boxes on a digital canvas, a specialized software engine reads your written logic and automatically renders the visual layout for you.
When using a modern diagram-as-code tool, the engine handles all the tedious layout work. If you add a new step in the middle of a complex flowchart, the software automatically repositions every arrow, box, and label so that the entire chart stays perfectly aligned without any manual effort.
Key Benefits of Using Text Instead of Drawing
- Lightning Speed: Type out your thoughts as fast as you write notes. The visual chart generates in real time.
- Version Control Ready: Because your diagrams are plain text files, you can easily save them in Git, track changes, compare differences, and collaborate with your team like software code.
- Consistent Formatting: No more crooked lines or mismatched font sizes. The visual engine ensures every shape follows clean, professional design standards.
- Zero Layout Headaches: Adding or removing steps takes seconds. The layout automatically updates without breaking surrounding elements.
Understanding Popular Diagramming Engines and DSLs
Different tasks call for different ways to describe information. Modern platforms combine multiple Domain-Specific Languages (DSLs) into one unified environment so you can choose the format that fits your project best.
Here are some of the most popular text-based diagramming engines available today:
| Engine / Format | Best Used For | Key Features |
|---|---|---|
| PlantUML | UML diagrams, systems logic | Flexible syntax, ideal for software architecture and interaction flows. |
| Mermaid | Flowcharts, Sequence Diagrams | Lightweight, easy-to-read syntax supported natively across many platforms. |
| Graphviz | Network graphs, complex trees | Exceptional automatic layout control for dense network nodes. |
| Markmap | Mind Maps | Converts simple Markdown bullet lists directly into interactive mind maps. |
| ECharts | Data charts & statistics | Renders rich, interactive statistical charts from simple data configurations. |

How to Write Your First Text-Based Diagram
Getting started with a free diagram-as-code tool is simple. You don’t need a degree in computer science to write simple visual scripts. Let’s look at two basic examples you can try immediately.
Example 1: A Process Flowchart in Mermaid
To create a simple decision flowchart, you simply define the direction of the flow and connect the steps with arrows:
graph TD
    A[Start Process] --> B{Is Code Correct?}
    B -- Yes --> C[Render Visual Diagram]
    B -- No --> D[Use AI Code Error Fixing]
    D --> B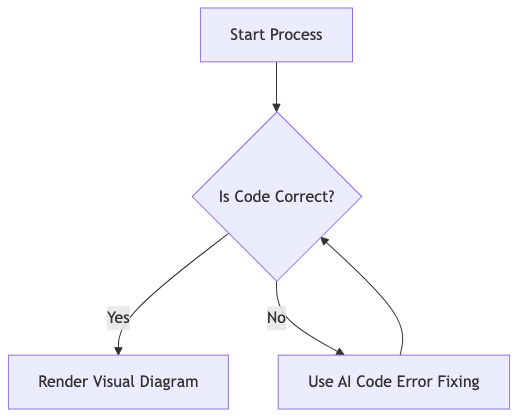
Example 2: A Sequence Diagram in PlantUML
If you want to show how messages pass between different users or systems over time, a sequence diagram is the perfect choice:
@startuml
User -> WebApp: Submit Form Data
WebApp -> Database: Save Record
Database --> WebApp: Confirmation
WebApp --> User: Display Success Message
@enduml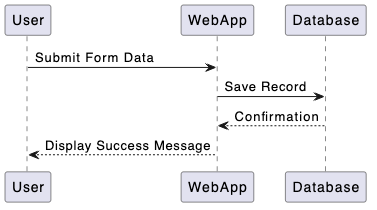
Visualizing Data, Config Files, and Programming Source Code
Diagramming with text is not limited to manual scripting languages like Mermaid or PlantUML. Modern platforms allow you to paste structured data formats or raw programming code directly into the editor to generate instant visual diagrams.
With a comprehensive text to diagram tool, you can automatically convert:
- Data & Config Files: Turn structured files in JSON, NDJSON / JSONL, YAML, XML, CSV, TOML, or TOON into clean hierarchical trees and visual data views.
- Database Schemas: Convert raw SQL scripts into clear Entity-Relationship Diagrams (ERDs) to visualize table structures and primary key relationships.
- Software Source Code: Paste source code written in Java, TypeScript, Go, Rust, C#, Python, C, C++, PHP, Ruby, Scala, Zig, Kotlin, Swift, or Elixir to automatically generate comprehensive UML class diagrams without manual mapping.
Introducing VPasCode: Your Unified Text-to-Diagram Workspace
If you want a seamless environment to explore diagramming with text, VPasCode (by Visual Paradigm) offers a powerful, web-based platform that brings all these engines and tools under one roof.
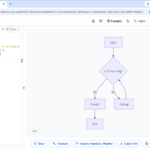
Instead of jumping between different single-purpose web apps, VPasCode gives you a unified online code editor paired with a live rendering preview window.
Standout Features That Make VPasCode Unique
- Automatic Code Detection: You don’t have to guess or manually select the exact syntax style. Simply paste your script into the editor, and VPasCode automatically identifies whether it is Mermaid, PlantUML, SQL, JSON, or source code.
- Smart AI Code Error Fixing: Made a syntax mistake in your script? With a single click, the “Fix by AI” feature analyzes the error, repairs the syntax bug, provides a side-by-side code diff showing what changed, and clearly explains the fix in simple terms.
- AI Diagram Label Translation: Effortlessly translate all text labels across your diagrams into different languages (e.g., converting “Withdraw Cash” into “提取现金”) with a single action, keeping your visual structure intact.
- OpenDocs Integration: Connect your diagrams directly to Visual Paradigm OpenDocs to keep living software documentation updated automatically across your engineering teams.
- High-Quality Export & Instant Sharing: Export your completed diagrams as high-resolution SVG vector files or sharp PNG images. You can also share your work instantly via direct web URL links or generated QR codes.
Best of all, core functionality like live editing, real-time preview rendering, and image exporting are 100% free to use online!
How to Get Started in 3 Simple Steps
You don’t need to install complicated software or configure local command-line tools to try a high-performance free diagram-as-code tool today.
- Open the Editor: Visit the online workspace in your browser.
- Type or Paste Your Text: Enter your Mermaid or PlantUML code, or paste structured data like JSON or SQL. The automatic detector instantly sets up the renderer.
- Preview and Export: Watch your visual render update instantly on the right side of your screen. When you’re satisfied, download your vector SVG or share a direct link with your team.
Whether you need to outline project timelines using Gantt charts, map out system transitions with State machine charts, detail operational flows through Activity diagrams, or visualize enterprise systems using C4 and ArchiMate Architecture models, switching to a text-driven workflow will save you hours of work.
Ready to Transform the Way You Create Diagrams?
Stop struggling with manual drawing tools. Try VPasCode today and experience how fast and easy it is to generate professional diagrams straight from plain text.