


Когда программисты, системные архитекторы и технические писатели нуждаются в составлении схем процессов, текстовое создание диаграмм часто является самым быстрым и легко поддерживаемым решением. Среди этих инструментов PlantUML выделяется как фаворит индустрии.
Однако новички часто сразу сталкиваются с препятствием: PlantUML не поддерживает тип диаграммы «блок-схема» на уровне ядра.
Хорошая новость? Вы можете легко создать чистую и функциональную блок-схемы PlantUML, используя синтаксис диаграммы деятельности PlantUML.
В этом руководстве вы узнаете, как PlantUML работает с блок-схемами, как пошагово писать основной синтаксис и как ускорить свой рабочий процесс с помощью современных инструментов, таких как VPasCode (который теперь поддерживает нативную генерацию с помощью ИИ прямо в приложении) и чат-бота Visual Paradigm AI для создания диаграмм. Для получения полной информации об этих новых возможностях ознакомьтесь с нашей Крупное обновление VPasCode: мгновенная генерация и изменение диаграмм с помощью ИИ.
Понимание блок-схем в PlantUML
Почему PlantUML использует диаграммы деятельности для блок-схем
В стандартах UML (Unified Modeling Language) блок-схемы и диаграммы деятельности имеют одну и ту же фундаментальную цель: визуализацию последовательной логики, точек принятия решений и условных путей выполнения.
Вместо поддержки двух избыточных форматов синтаксиса PlantUML использует свой современный движок диаграмм деятельности (новый синтаксис) в качестве полноценного блок-схемы PlantUML. Он предлагает чистый, легко читаемый код, который напрямую рендерится в структурированные визуальные потоки.
Создание первой скриптовой блок-схемы PlantUML
Написание блок-схемы PlantUML требует лишь нескольких основных элементов разметки. Каждая диаграмма начинается с @startuml и завершается @enduml.
Обзор базового синтаксиса
- Начало и конец:
startиstopобозначают границы выполнения. - Шаги процесса: Заключаются в двоеточия и завержаются точкой с запятой, например
:Выполнить действие;. - Узлы решений: Записываются с использованием
if (...) then (...) else (...) endifструктур.
Пошаговый пример кода: Логика входа пользователя
Вот как можно написать стандартный диаграмму потоков на основе решений PlantUML flowchart:
@startuml
start
:Пользователь вводит учетные данные для входа;

if (Учетные данные действительны?) then (да)
    :Аутентифицировать сессию пользователя;
    :Перенаправить на панель управления пользователя;
    :Отобразить приветственное уведомление;
else (нет)
    :Отобразить сообщение об ошибке;
    :Увеличить счетчик неудачных попыток входа;
    if (Количество неудачных попыток > 3?) then (да)
        :Временно заблокировать учетную запись;
    else (нет)
        :Предложить пользователю повторить попытку;
    endif
endif

stop
@enduml
Визуализация ветвлений решений и циклов
Поскольку синтаксис читается как стандартный псевдокод, вложенность решений или создание повторяющихся циклов остается чистой и читаемой. Вы можете добавлять явные метки к направленным стрелкам, просто передавая текст параметров в скобках после then или иначе.
Ускорение создания диаграмм с помощью ИИ
Хотя ручное написание кода DSL для небольших процессов является простой задачей, сложные архитектуры систем могут требовать десятков путей принятия решений. Вы можете значительно сократить время настройки, используя ИИ для прямого преобразования описаний на естественном языке в стандартный код PlantUML. Это можно сделать двумя гибкими способами:
Способ 1: Нативная генерация с помощью ИИ внутри приложения в VPasCode
Благодаря последним улучшениям VPasCode теперь обладает встроенными возможностями ИИ непосредственно в интерфейсе приложения.
- Откройтередактор VPasCode.
- НажмитеГенерировать с помощью ИИкнопку на верхней панели инструментов.
- Введите запрос на естественном языке — например,«Создать блок-схему в PlantUML для процесса отмены заказа в электронной коммерции».
- VPasCode нативно сгенерирует код и мгновенно отобразит диаграмму на вашем экране.
Способ 2: Использование чат-бота Visual Paradigm для создания диаграмм с помощью ИИ
Альтернативно вы можете создавать свои модели через нашу специализированную интеграцию с чат-ботом:
- Определите свою цель:Опишите свой процесс на простом английском языке внутричат-бота Visual Paradigm для создания диаграмм с помощью ИИ.
- Сгенерируйте скрипт:Чат-бот на базе ИИ анализирует логику и мгновенно генерирует корректный код диаграммы PlantUML.
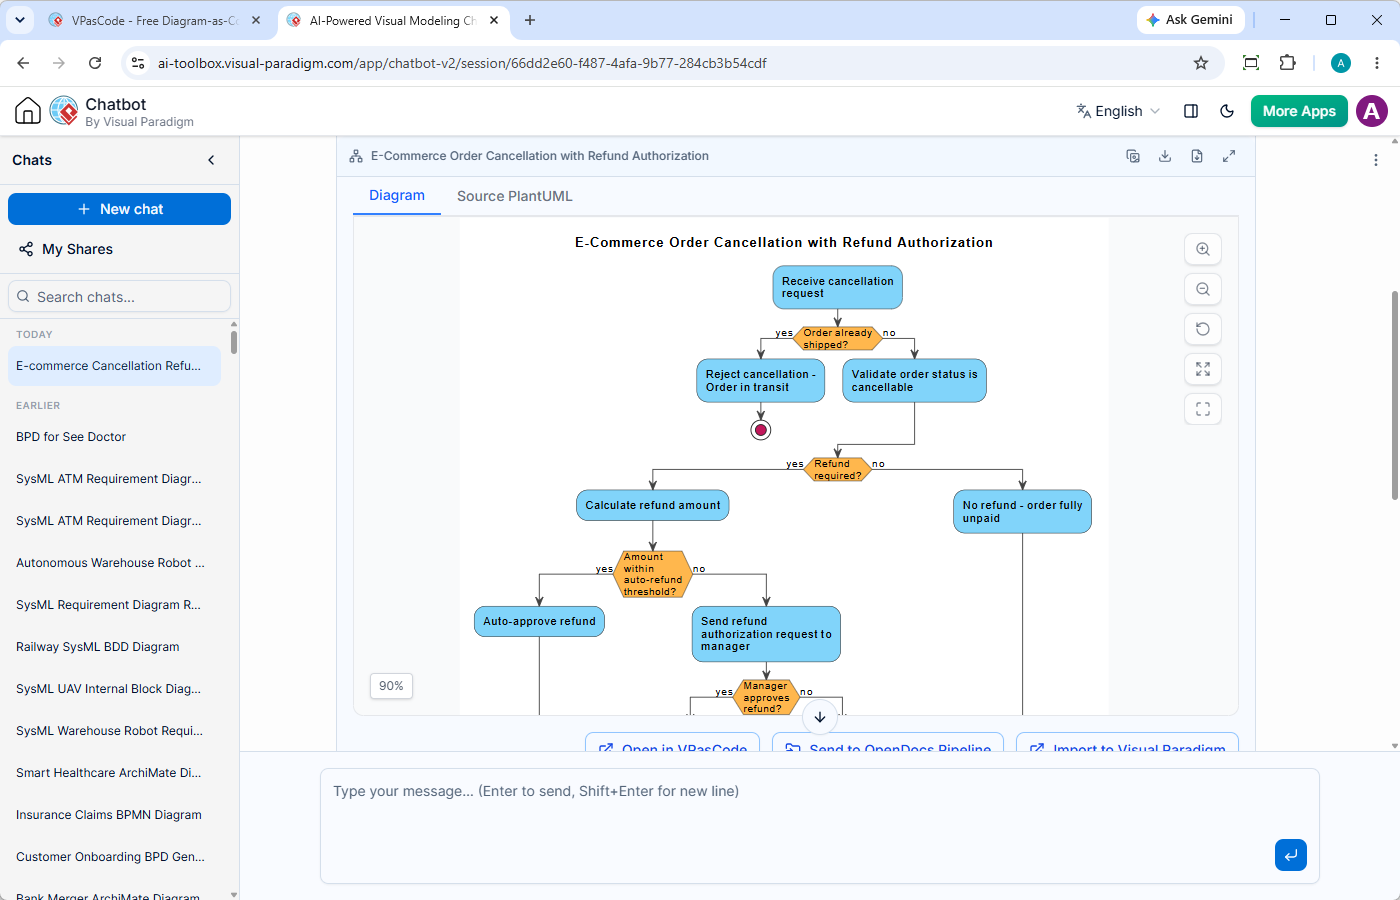
- Открыть в VPasCode:Перенесите созданную диаграмму в VPasCodeинструмент PlantUMLдля мгновенной визуализации и доработки.
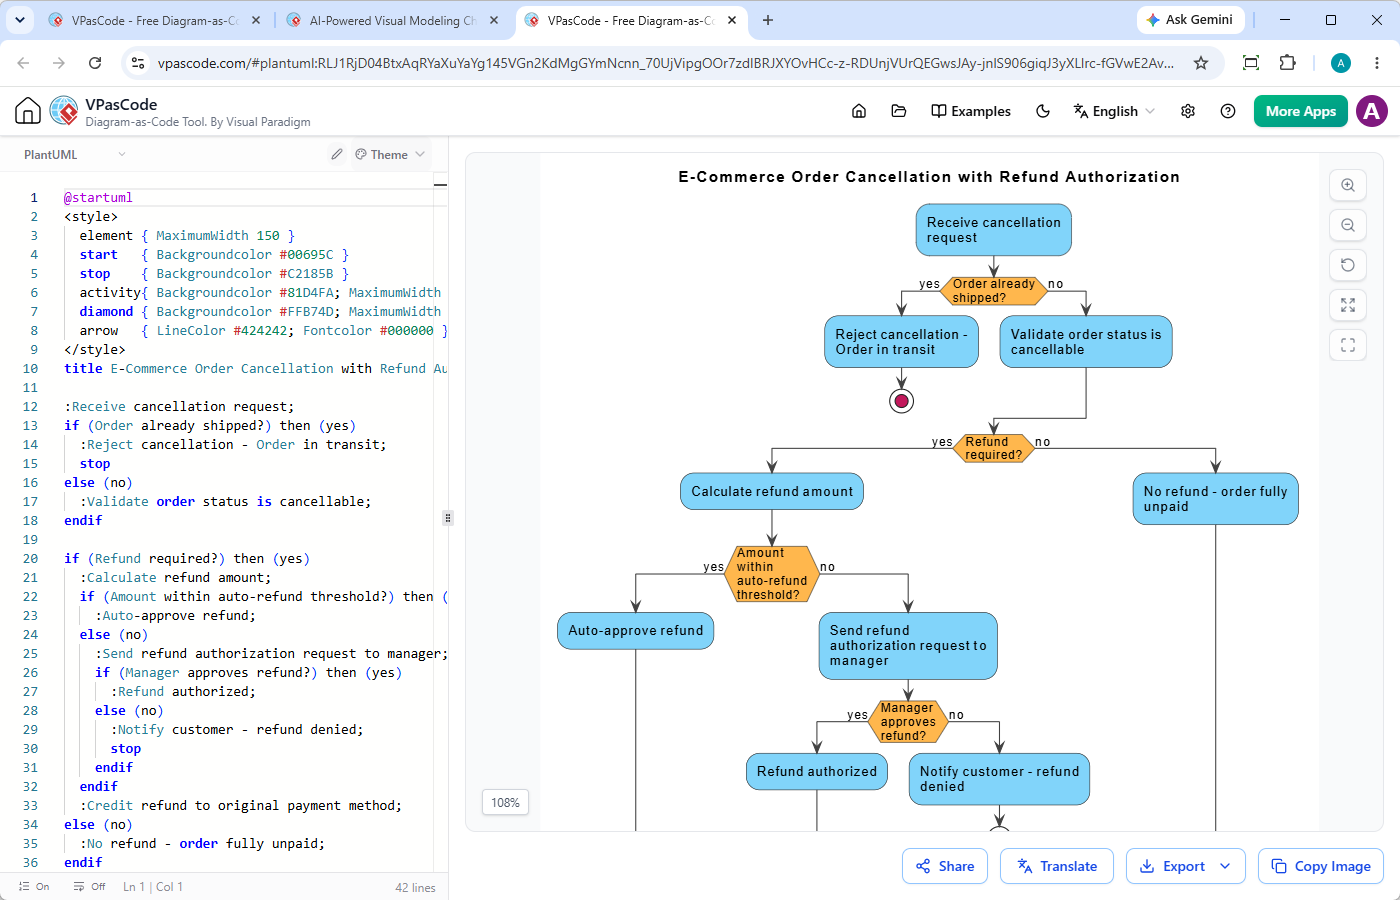
Уточнение и редактирование диаграмм с помощью Visual Paradigm VPasCode
После того как вы сгенерировали или вручную написали свой скрипт PlantUML, вам необходимо высокопроизводительное рабочее пространство для тестирования, предварительного просмотра и кастомизации ваших визуализаций. Именно здесьVisual Paradigm VPasCode (vpascode.com) обеспечивает бесшовную среду редактора.
- Создавайте свои диаграммы с помощью встроенного в приложение искусственного интеллекта или чат-бота ИИ.
- Проверяйте и дорабатывайте модель в инструменте VPasCode для диаграмм как кода.
- Тонко настройте и экспортируйте как изображение или поделитесь им с другими.
Ключевые возможности VPasCode для рабочих процессов диаграмм как кода
- Автоматическое определение формата:Вставьте исходный скрипт в редактор, и VPasCode автоматически определит PlantUML, Mermaid или Graphviz, не заставляя вас выбирать из выпадающего меню.
- Предпросмотр в реальном времени:Изменения, внесенные в панель кода, мгновенно отображаются в окне рендеринга, что делает правку макета быстрой и интерактивной.
- Исправление ошибок кода и модификация с помощью ИИ:Если вы допустили синтаксическую ошибку или хотите изменить свою блок-схему, используйте интеллектуальные инструменты диагностики и модификации на базе ИИ от VPasCode.(Примечание: Расширенные функции генерации диаграмм с помощью ИИ, их модификации и исправления ошибок доступны в версии Visual Paradigm Online Deluxe Edition / Visual Paradigm Desktop Professional Edition+).
- Нативный перевод:Нужно представить свою архитектуру международной команде? Переводите текст и подписи на несколько языков непосредственно внутри платформы.
- Экспорт векторов высокого разрешения:Скачивайте готовые диаграммы в виде масштабируемых файлов SVG для платформ документации, таких как OpenDocs, или в виде изображений PNG высокого разрешения для презентаций.
Часто задаваемые вопросы (FAQ)
Могу ли я создавать стандартные блок-схемы непосредственно в PlantUML?
Хотя в PlantUML нет отдельного ключевого слова «блок-схема», его диаграмма деятельностисинтаксис удовлетворяет всем требованиям блок-схем, что делает его стандартным методом рендеринга блок-схемы PlantUML.
Какой онлайн-редактор PlantUML является лучшим?
Visual Paradigm VPasCode (vpascode.com) предлагает мощный браузерный редактор с автоматическим определением языка, предпросмотром в реальном времени, инструментами с поддержкой ИИ и экспортом векторных SVG.
Краткое содержание
Создание блок-схемы PlantUMLпрост, если вы используете синтаксис диаграмм деятельности. Комбинируя генерацию на основе промптов с помощью ИИ — либо нативно в VPasCode, либо через чат-бота ИИ — с мощным редактированием диаграмм как кода, вы можете за несколько минут превратить краткую текстовую идею в отполированную профессиональную векторную диаграмму.
Ссылки
Related posts:
 Можно ли экспортировать диаграммы PlantUML? Полное руководство по форматам & методам
 Преимущества PlantUML: почему инженерные команды переходят от ручного рисования к коду
 Может ли PlantUML создавать интеллект-карты? Полное руководство по синтаксису и подходу «диаграмма как код»
 Устарел ли PlantUML? Правда о диаграммах как коде в 2026 году