


When tracking continuous transfers, resource distributions, or multi-stage user journeys, the Sankey Chart is the premier visualization tool. By drawing proportional flow bands between sequential stage nodes, Sankey charts illustrate how total quantities split, combine, and transition through complex systems—such as website user conversion funnels, energy distribution grids, or organizational budget allocations.
The Mechanics of Sankey Charts
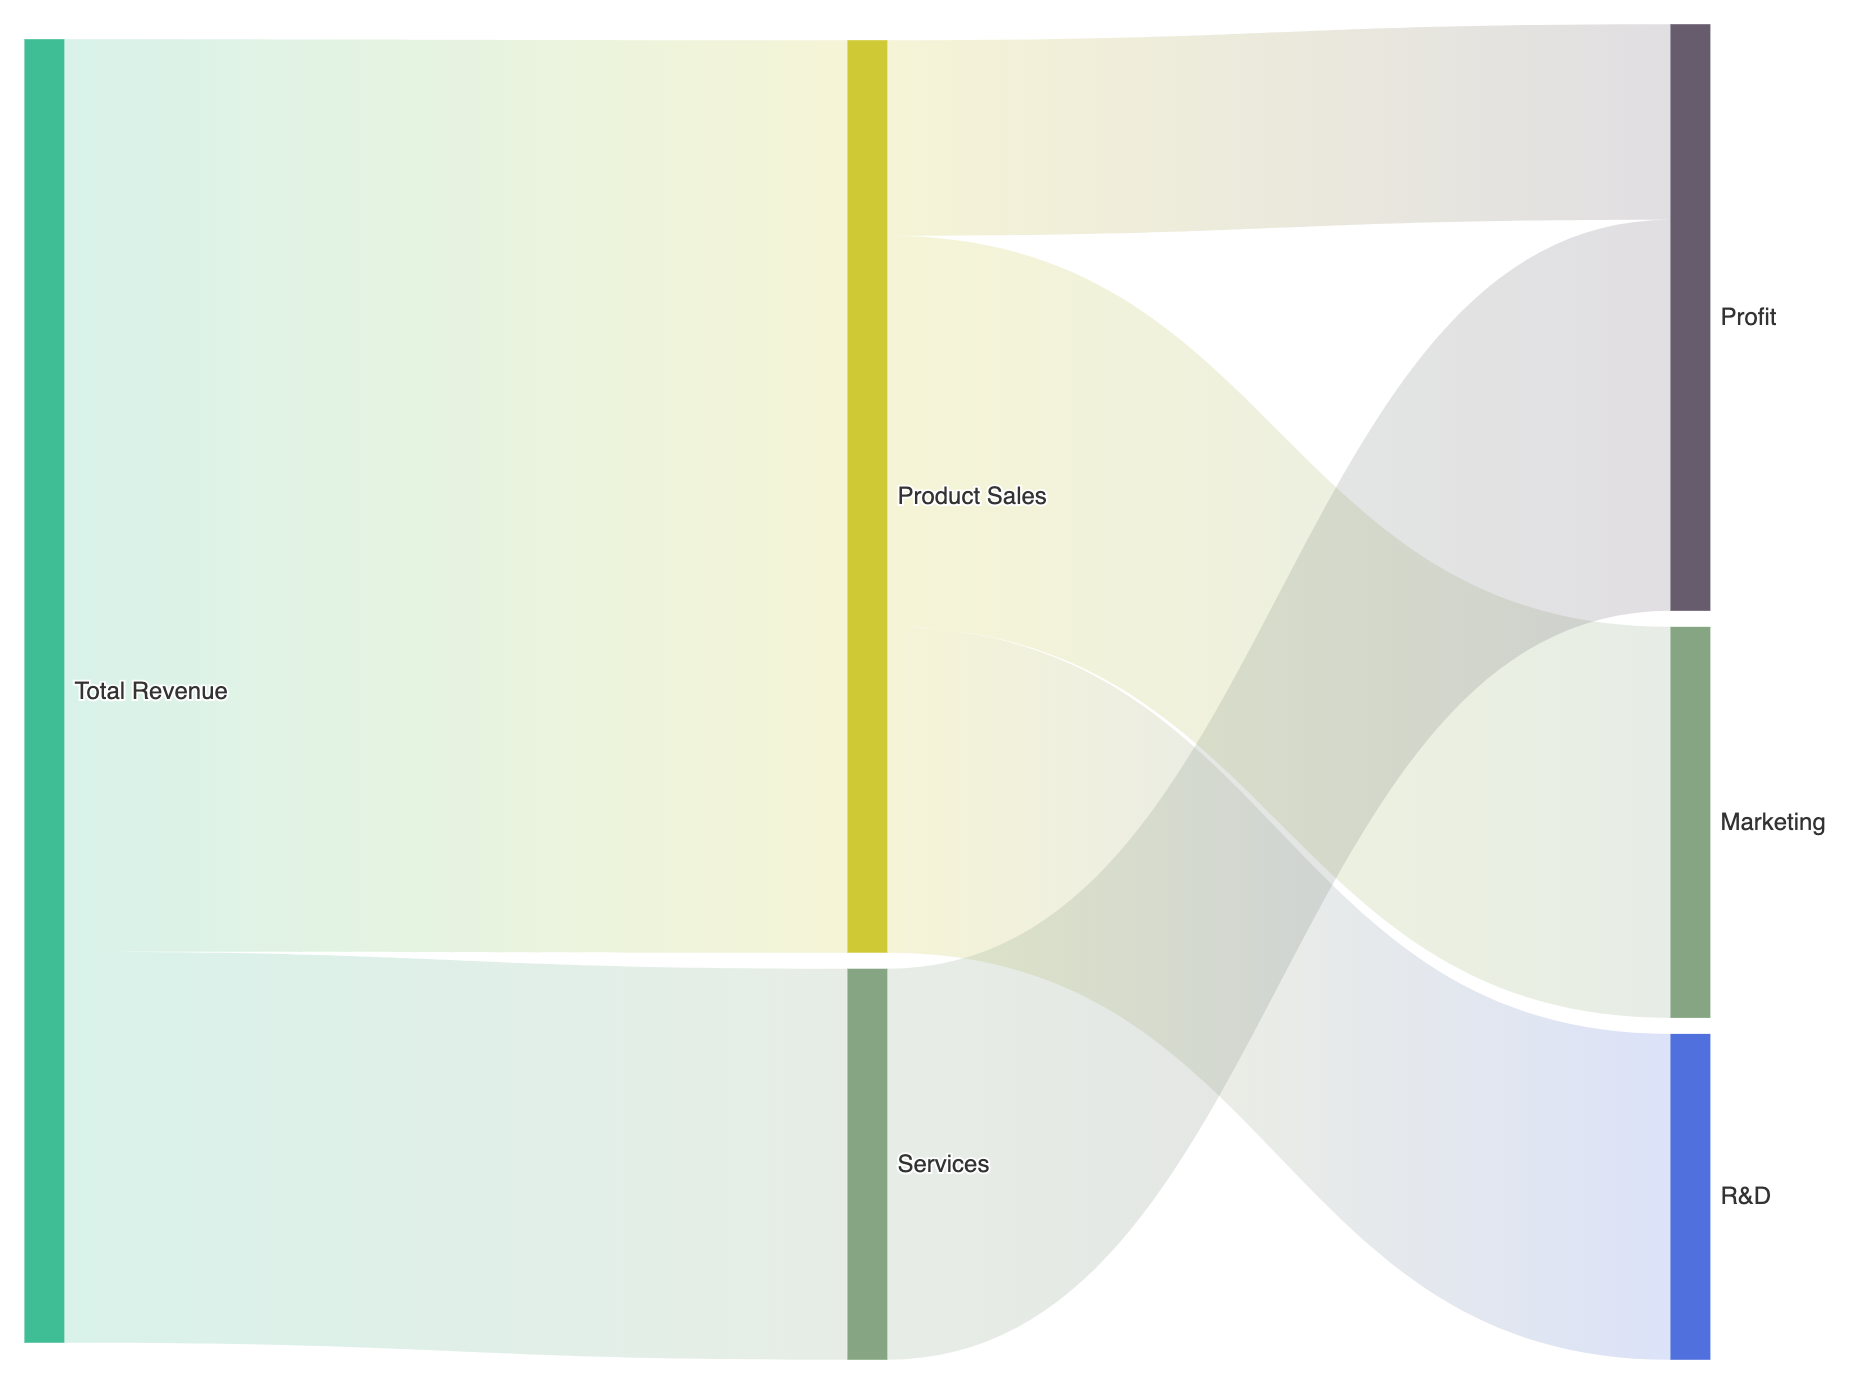
In Apache ECharts, Sankey charts use type: 'sankey'. Similar to graph charts, a Sankey plot is defined by a list of distinct nodes (or data) and directed links (or edges). Each link contains a source node name, a target node name, and a numeric value that determines the visual width of the connecting flow line.
1. Essential Setup
To construct a basic Sankey chart, declare your node items inside data and define directed flow volumes in links:
option = {
    tooltip: {
        trigger: 'item',
        triggerOn: 'mousemove'
    },
    series: [
        {
            type: 'sankey',
            data: [
                { name: 'Total Revenue' },
                { name: 'Product Sales' },
                { name: 'Services' },
                { name: 'Marketing' },
                { name: 'R&D' },
                { name: 'Profit' }
            ],
            links: [
                { source: 'Total Revenue', target: 'Product Sales', value: 70 },
                { source: 'Total Revenue', target: 'Services', value: 30 },
                { source: 'Product Sales', target: 'Marketing', value: 30 },
                { source: 'Product Sales', target: 'R&D', value: 25 },
                { source: 'Product Sales', target: 'Profit', value: 15 },
                { source: 'Services', target: 'Profit', value: 30 }
            ],
            emphasis: {
                focus: 'adjacency'
            },
            lineStyle: {
                color: 'gradient',
                curveness: 0.5
            }
        }
    ]
};
Advanced Structural Techniques
Sankey charts can be customized with vertical flow orientations, multi-level node colors, and dynamic link highlighting to trace individual paths through intricate networks.
1. Vertical Flow Orientation
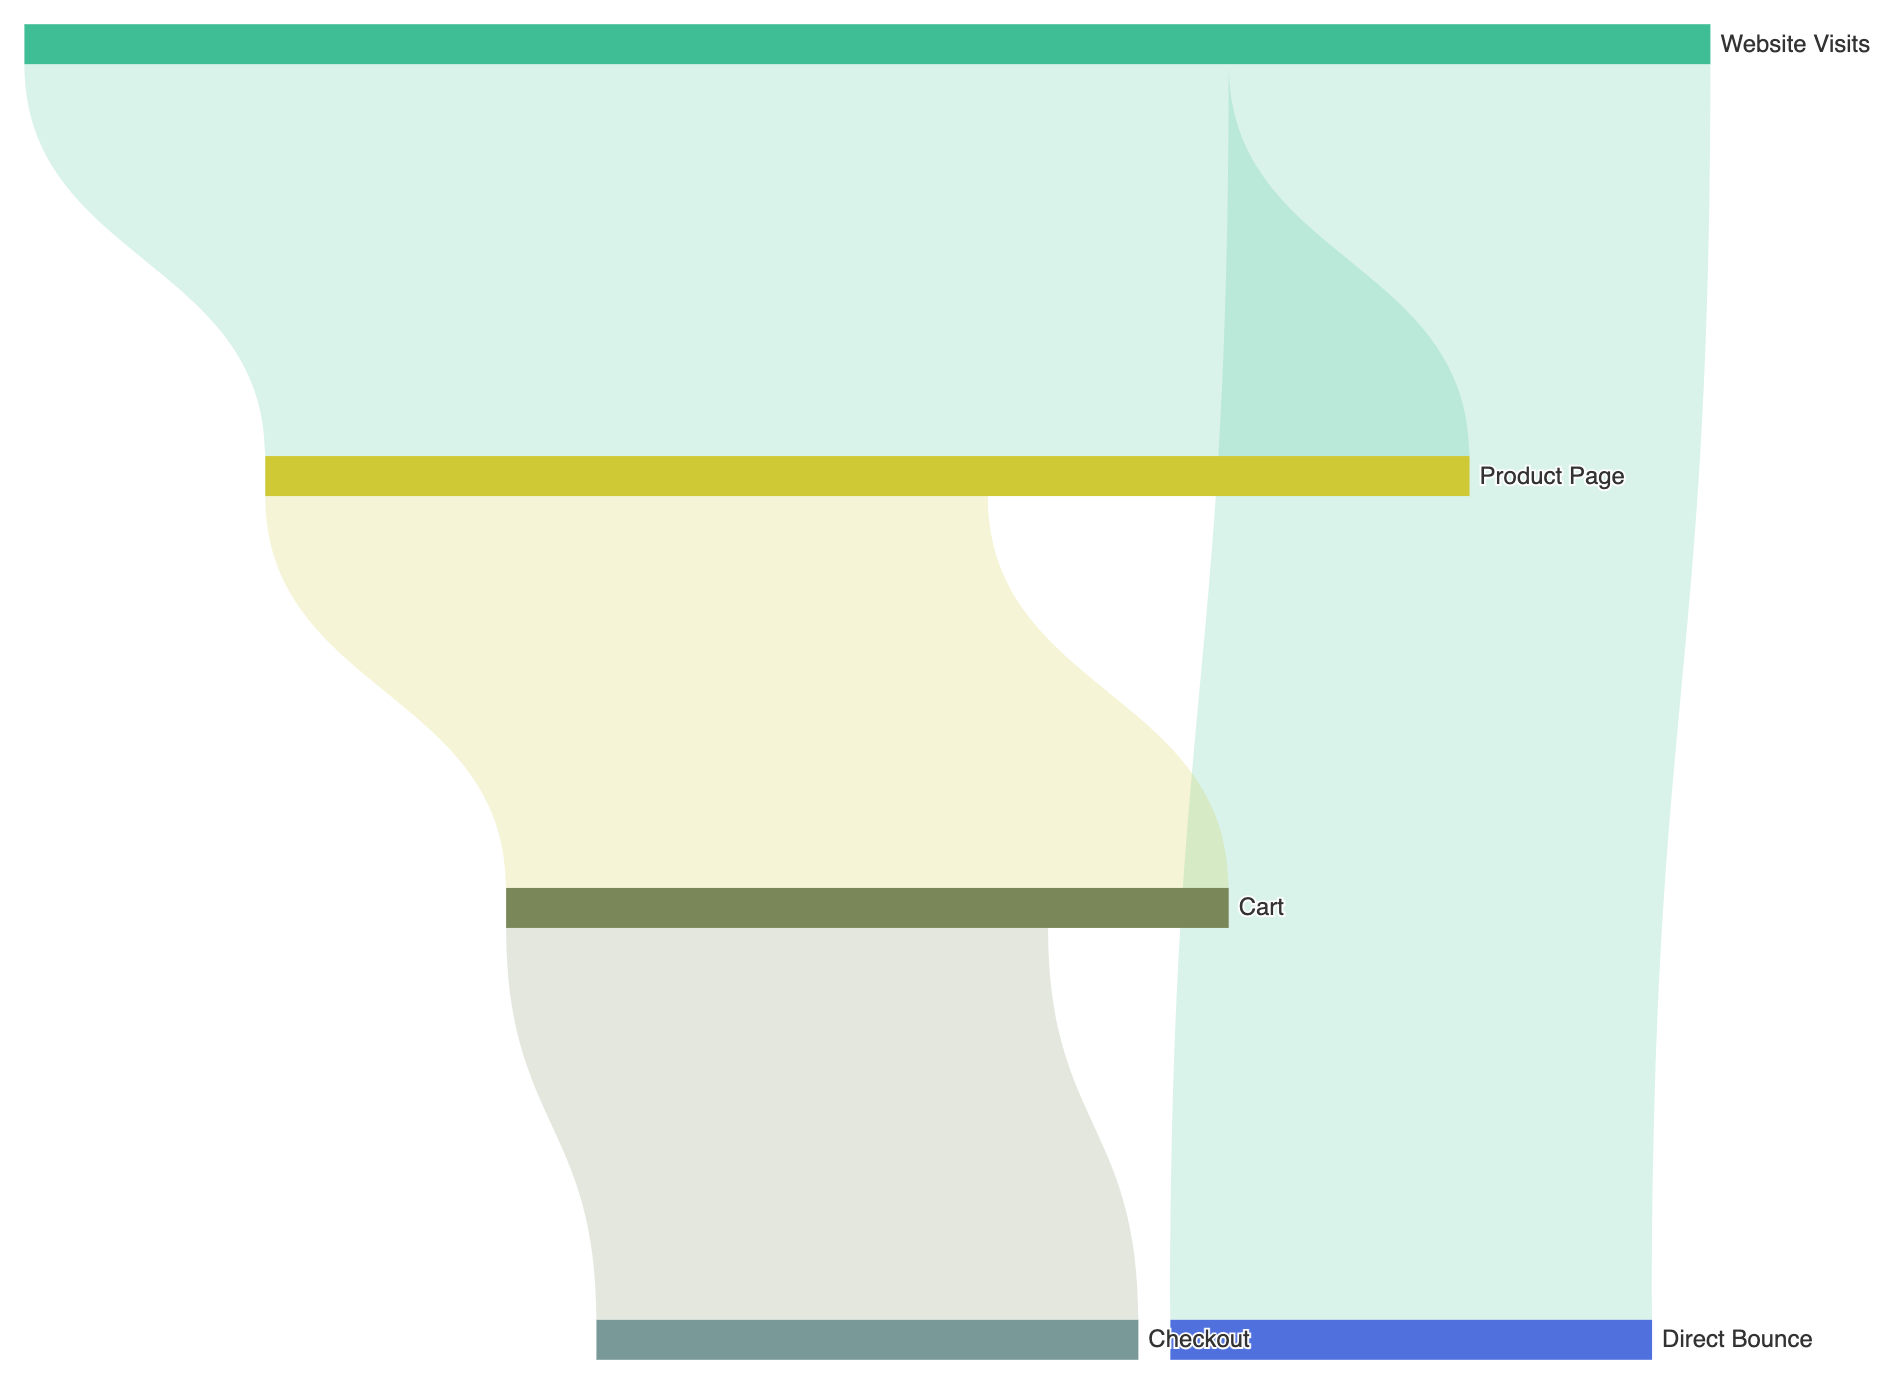
Set orient: 'vertical' to transform horizontal stage flows into a top-to-bottom vertical waterfall view:
option = {
    tooltip: {
        trigger: 'item',
        triggerOn: 'mousemove'
    },
    series: [
        {
            type: 'sankey',
            orient: 'vertical',
            nodeWidth: 20,
            nodeGap: 16,
            data: [
                { name: 'Website Visits' },
                { name: 'Product Page' },
                { name: 'Direct Bounce' },
                { name: 'Cart' },
                { name: 'Checkout' }
            ],
            links: [
                { source: 'Website Visits', target: 'Product Page', value: 1000 },
                { source: 'Website Visits', target: 'Direct Bounce', value: 400 },
                { source: 'Product Page', target: 'Cart', value: 600 },
                { source: 'Cart', target: 'Checkout', value: 450 }
            ],
            lineStyle: {
                color: 'source',
                curveness: 0.5
            }
        }
    ]
};
Fine-Tuning Layout and Link Styling
Adjusting node spacing, line curvature, and hover highlight behaviors keeps complex multi-stage flows clean and readable.
1. Node Gap Controls and Source-Target Gradient Flows
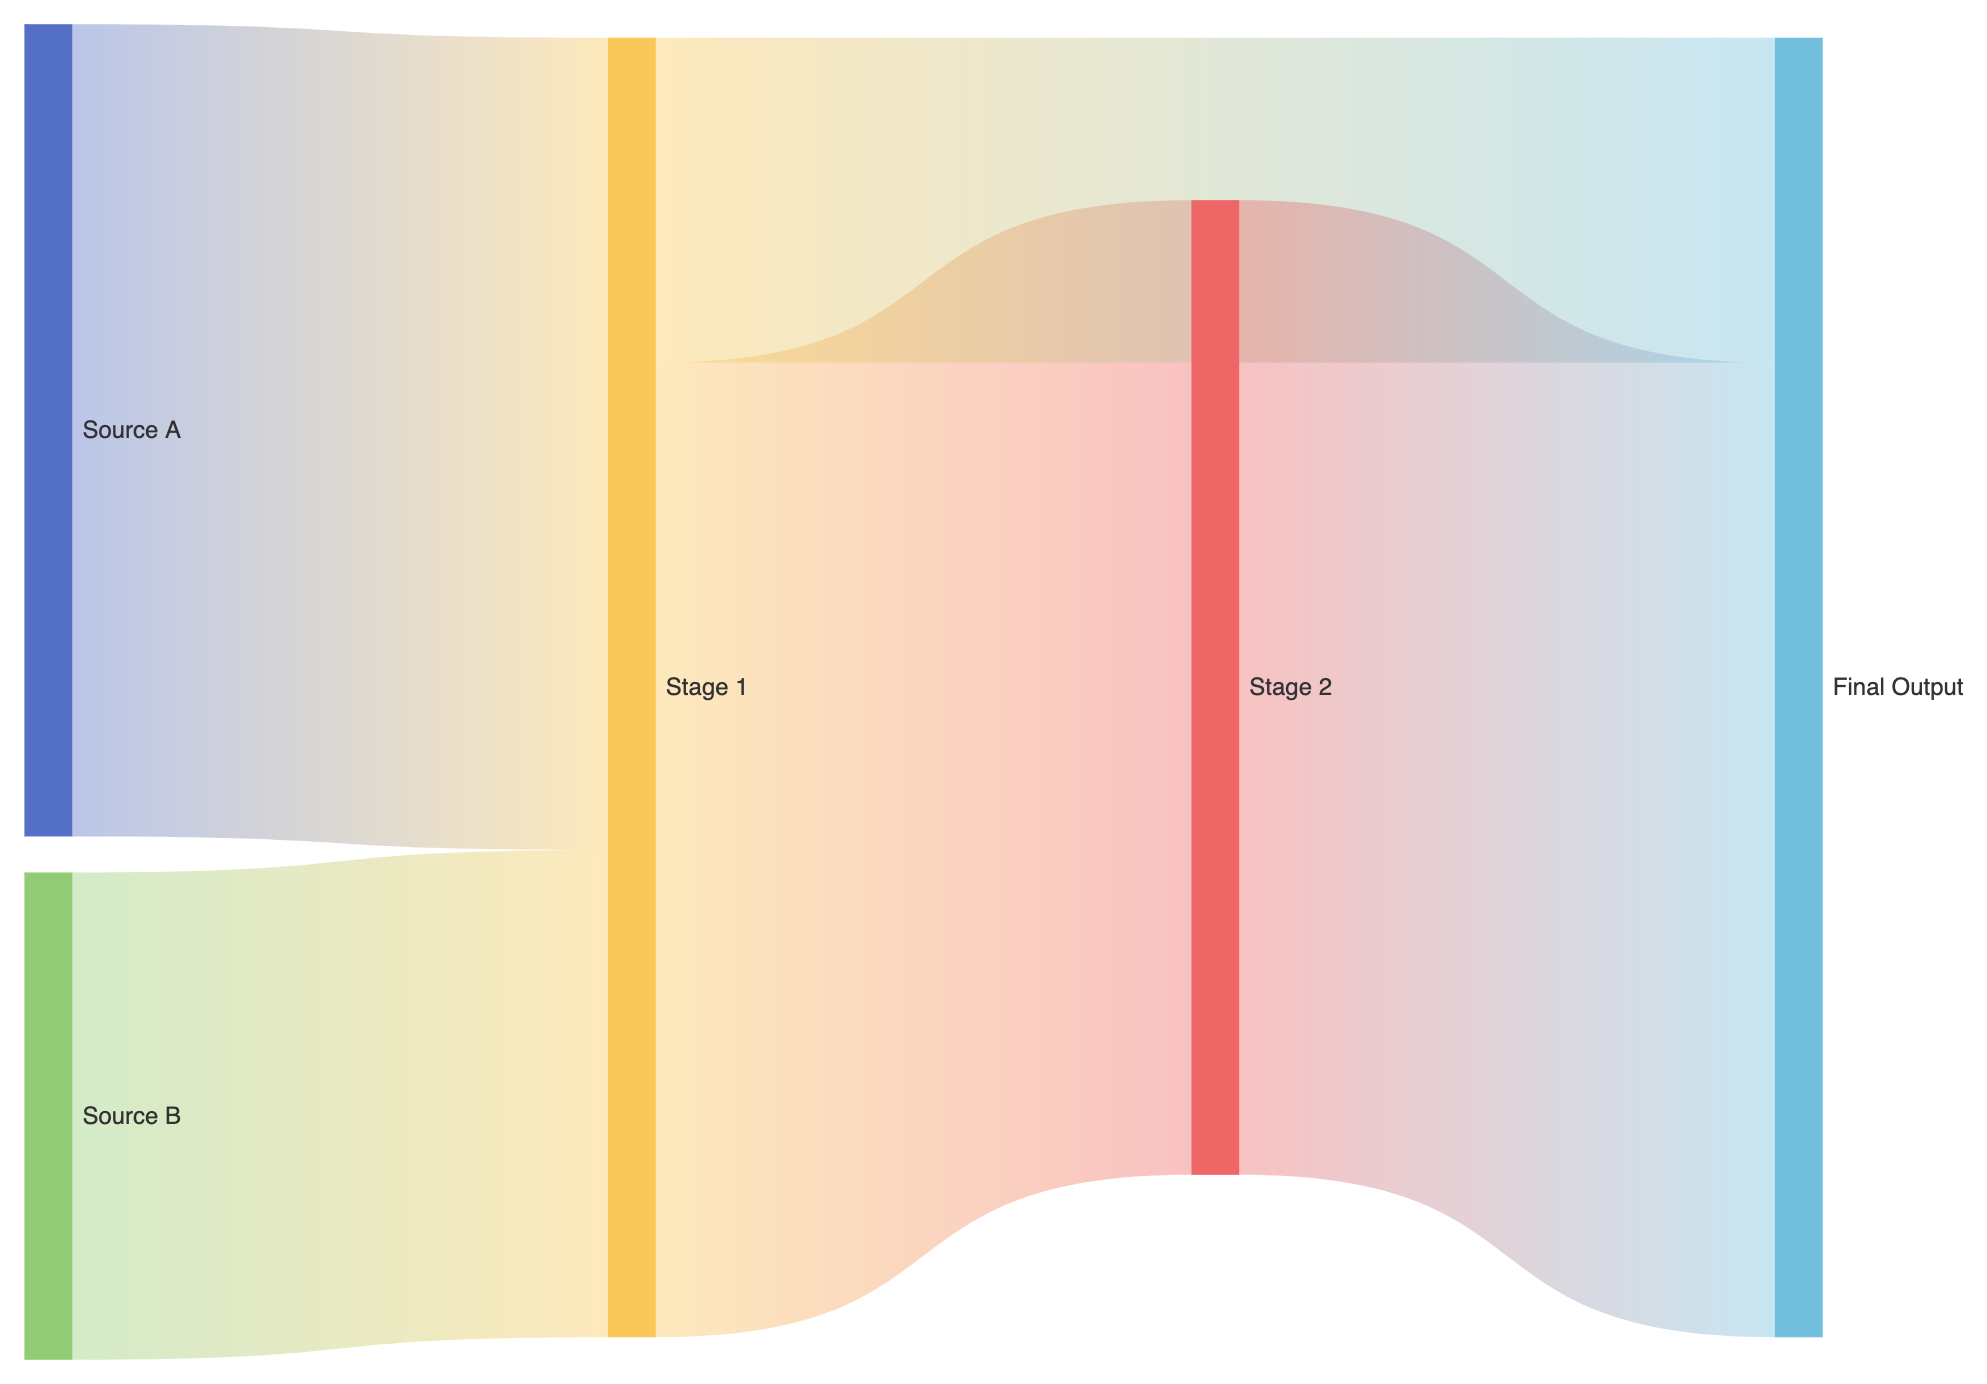
Customizing nodeGap and setting lineStyle.color: 'gradient' creates smooth color transitions between stages:
option = {
    series: [
        {
            type: 'sankey',
            left: '5%',
            right: '15%',
            nodeWidth: 24,
            nodeGap: 18,
            draggable: true,
            label: {
                position: 'right',
                color: '#333',
                fontSize: 12
            },
            data: [
                { name: 'Source A', itemStyle: { color: '#5470c6' } },
                { name: 'Source B', itemStyle: { color: '#91cc75' } },
                { name: 'Stage 1', itemStyle: { color: '#fac858' } },
                { name: 'Stage 2', itemStyle: { color: '#ee6666' } },
                { name: 'Final Output', itemStyle: { color: '#73c0de' } }
            ],
            links: [
                { source: 'Source A', target: 'Stage 1', value: 50 },
                { source: 'Source B', target: 'Stage 1', value: 30 },
                { source: 'Stage 1', target: 'Stage 2', value: 60 },
                { source: 'Stage 1', target: 'Final Output', value: 20 },
                { source: 'Stage 2', target: 'Final Output', value: 60 }
            ],
            lineStyle: {
                color: 'gradient',
                curveness: 0.6,
                opacity: 0.4
            }
        }
    ]
};
Strategic Best Practices
- Maintain Conservation of Flow: Ensure the sum of values flowing into a node equals or logically accounts for the outgoing values to prevent misleading visual gaps.
- Enable
emphasis.focus: 'adjacency': When dealing with multi-stage flows, focusing on adjacent links on hover allows users to isolate specific pathways without visual noise. - Use Gradient Links: Setting
lineStyle.color: 'gradient'smoothly blends the source node color into the target node color, making multi-stage transitions visually intuitive.