


When presenting structured data with clear parent-child relationships—such as organizational charts, file system directories, decision trees, or taxonomy classifications—the Tree Chart provides an intuitive visual framework. By arranging data nodes along branching paths, tree charts allow users to explore nested hierarchies and trace connections from a central root node down through sub-branches.
The Mechanics of Tree Charts
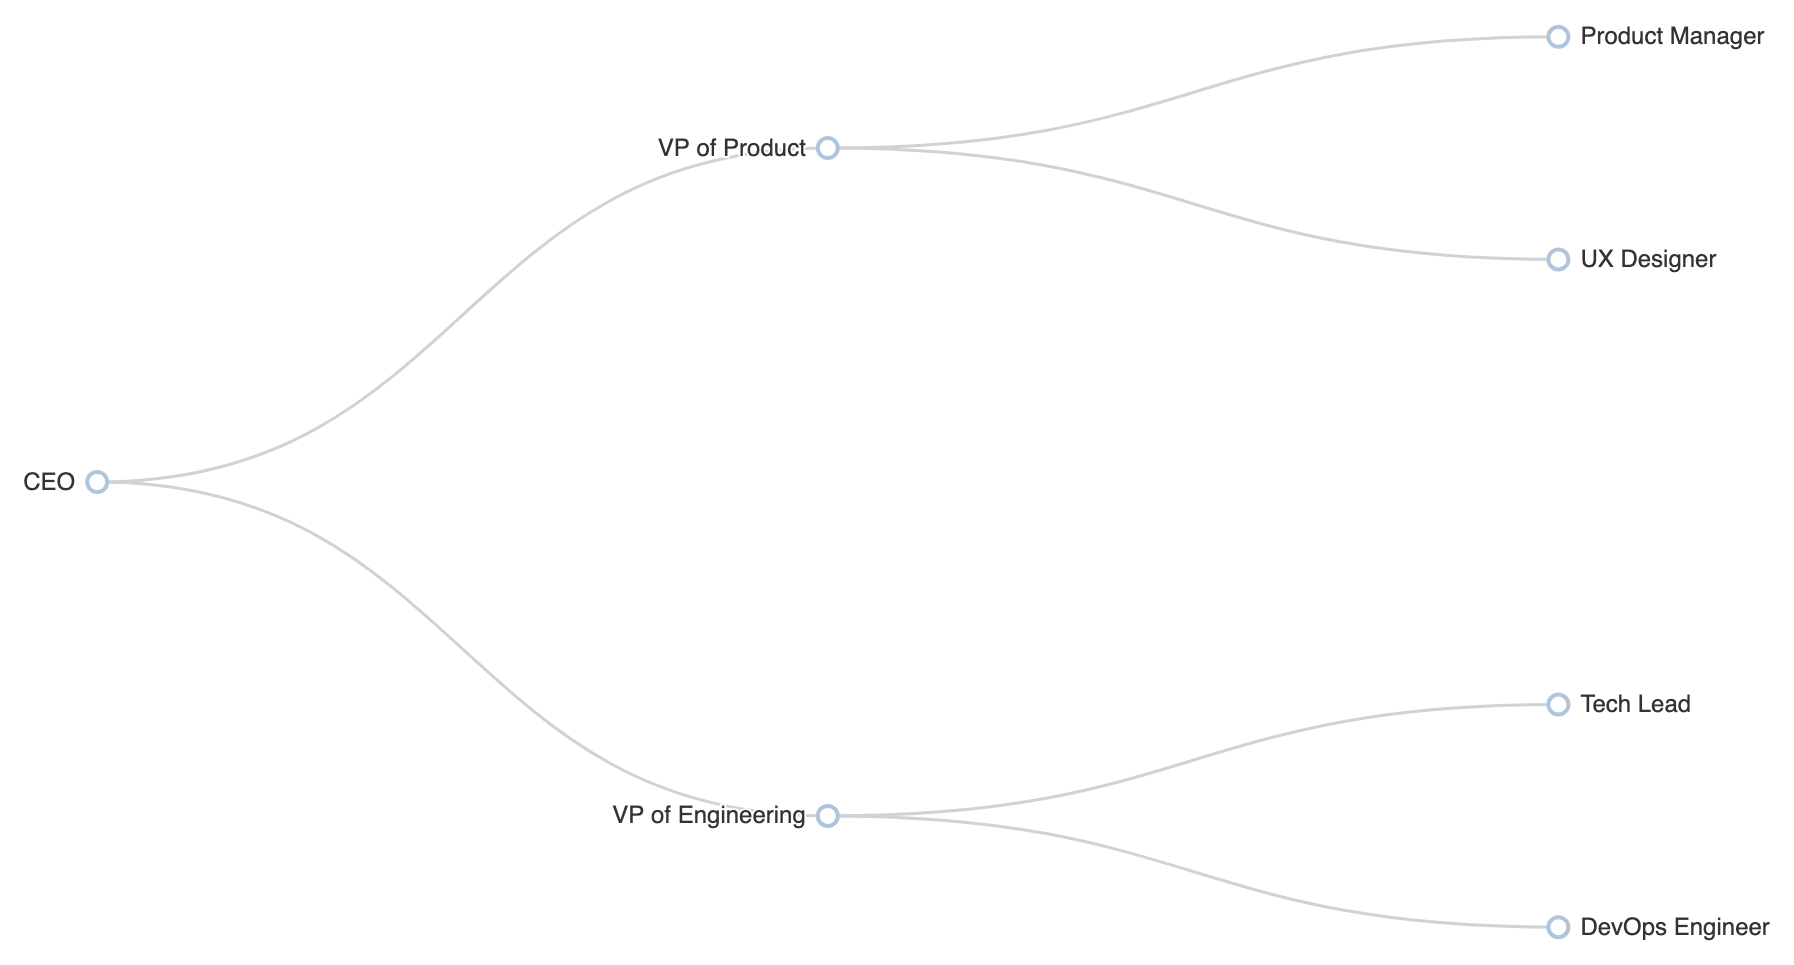
In Apache ECharts, tree charts use type: 'tree'. Unlike standard charts with explicit X and Y axes, tree charts construct layout positions automatically from a nested JavaScript object containing a name and an optional children array.
1. Essential Setup
To construct a basic tree chart, define your nested data structure and set type: 'tree' inside the series array:
option = {
    tooltip: {
        trigger: 'item',
        triggerOn: 'mousemove'
    },
    series: [
        {
            type: 'tree',
            data: [{
                name: 'CEO',
                children: [
                    {
                        name: 'VP of Product',
                        children: [
                            { name: 'Product Manager' },
                            { name: 'UX Designer' }
                        ]
                    },
                    {
                        name: 'VP of Engineering',
                        children: [
                            { name: 'Tech Lead' },
                            { name: 'DevOps Engineer' }
                        ]
                    }
                ]
            }],
            top: '5%',
            left: '15%',
            bottom: '5%',
            right: '20%',
            symbolSize: 10,
            label: {
                position: 'left',
                verticalAlign: 'middle',
                align: 'right',
                fontSize: 12
            },
            leaves: {
                label: {
                    position: 'right',
                    verticalAlign: 'middle',
                    align: 'left'
                }
            },
            expandAndCollapse: true,
            animationDurationUpdate: 750
        }
    ]
};
Advanced Layout Orientations
Tree charts can adapt to different space constraints and design requirements by changing their layout direction or switching to a radial display.
1. Radial Tree Layout
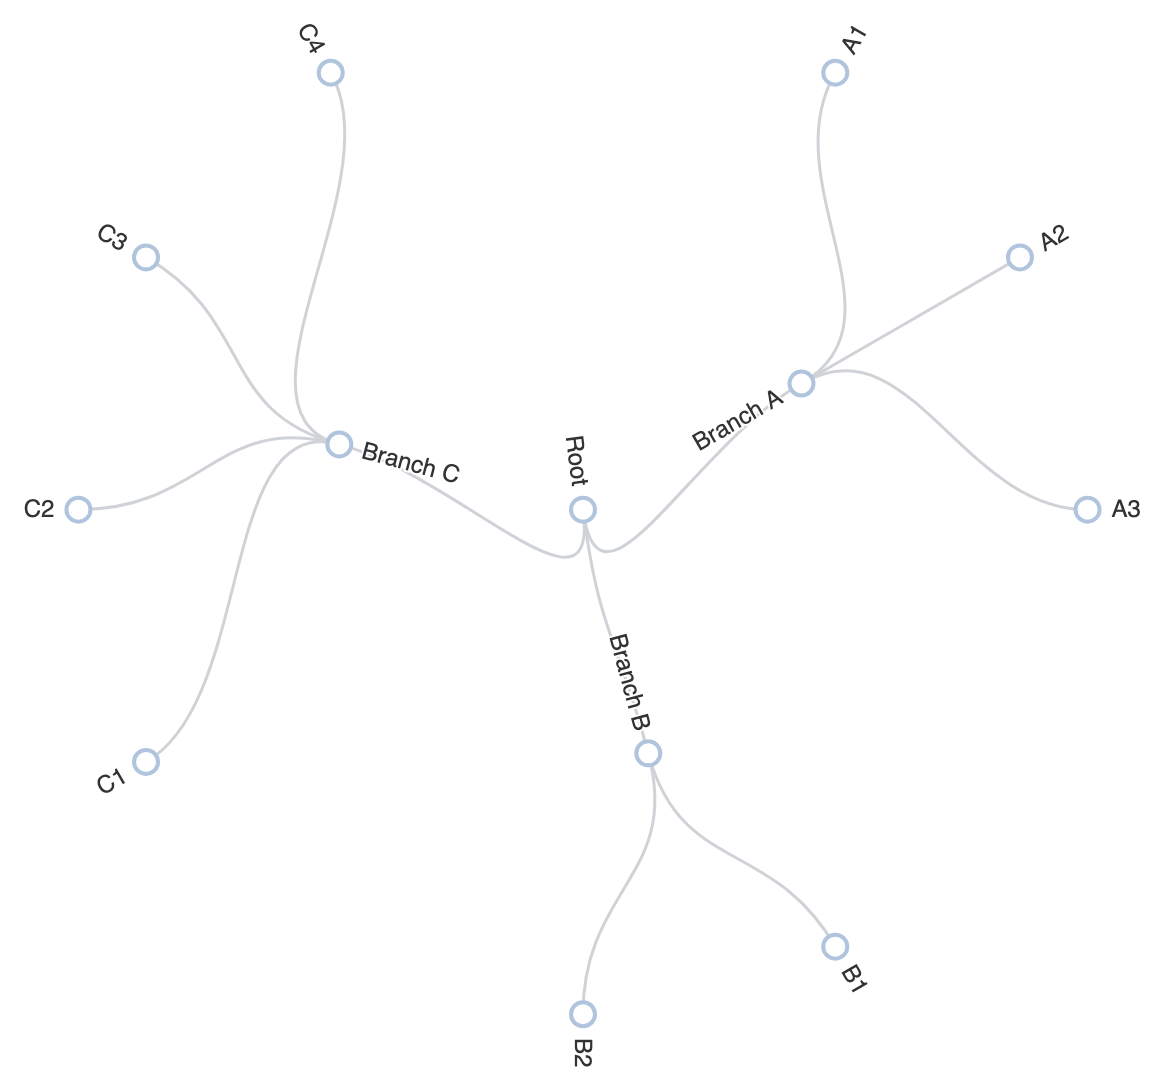
Set layout: 'radial' to project branches outward from a center point, ideal for wide hierarchies with many leaf nodes:
option = {
    tooltip: {
        trigger: 'item',
        triggerOn: 'mousemove'
    },
    series: [
        {
            type: 'tree',
            layout: 'radial',
            data: [{
                name: 'Root',
                children: [
                    {
                        name: 'Branch A',
                        children: [
                            { name: 'A1' },
                            { name: 'A2' },
                            { name: 'A3' }
                        ]
                    },
                    {
                        name: 'Branch B',
                        children: [
                            { name: 'B1' },
                            { name: 'B2' }
                        ]
                    },
                    {
                        name: 'Branch C',
                        children: [
                            { name: 'C1' },
                            { name: 'C2' },
                            { name: 'C3' },
                            { name: 'C4' }
                        ]
                    }
                ]
            }],
            top: '18%',
            bottom: '14%',
            right: '18%',
            left: '18%',
            symbolSize: 12,
            initialTreeDepth: 2,
            animationDurationUpdate: 750
        }
    ]
};
Fine-Tuning Layout and Styling
Customizing node symbols, line curves, and level-specific formatting helps highlight key structural tiers across large diagrams.
1. Curved Connectors and Level-Based Node Styling
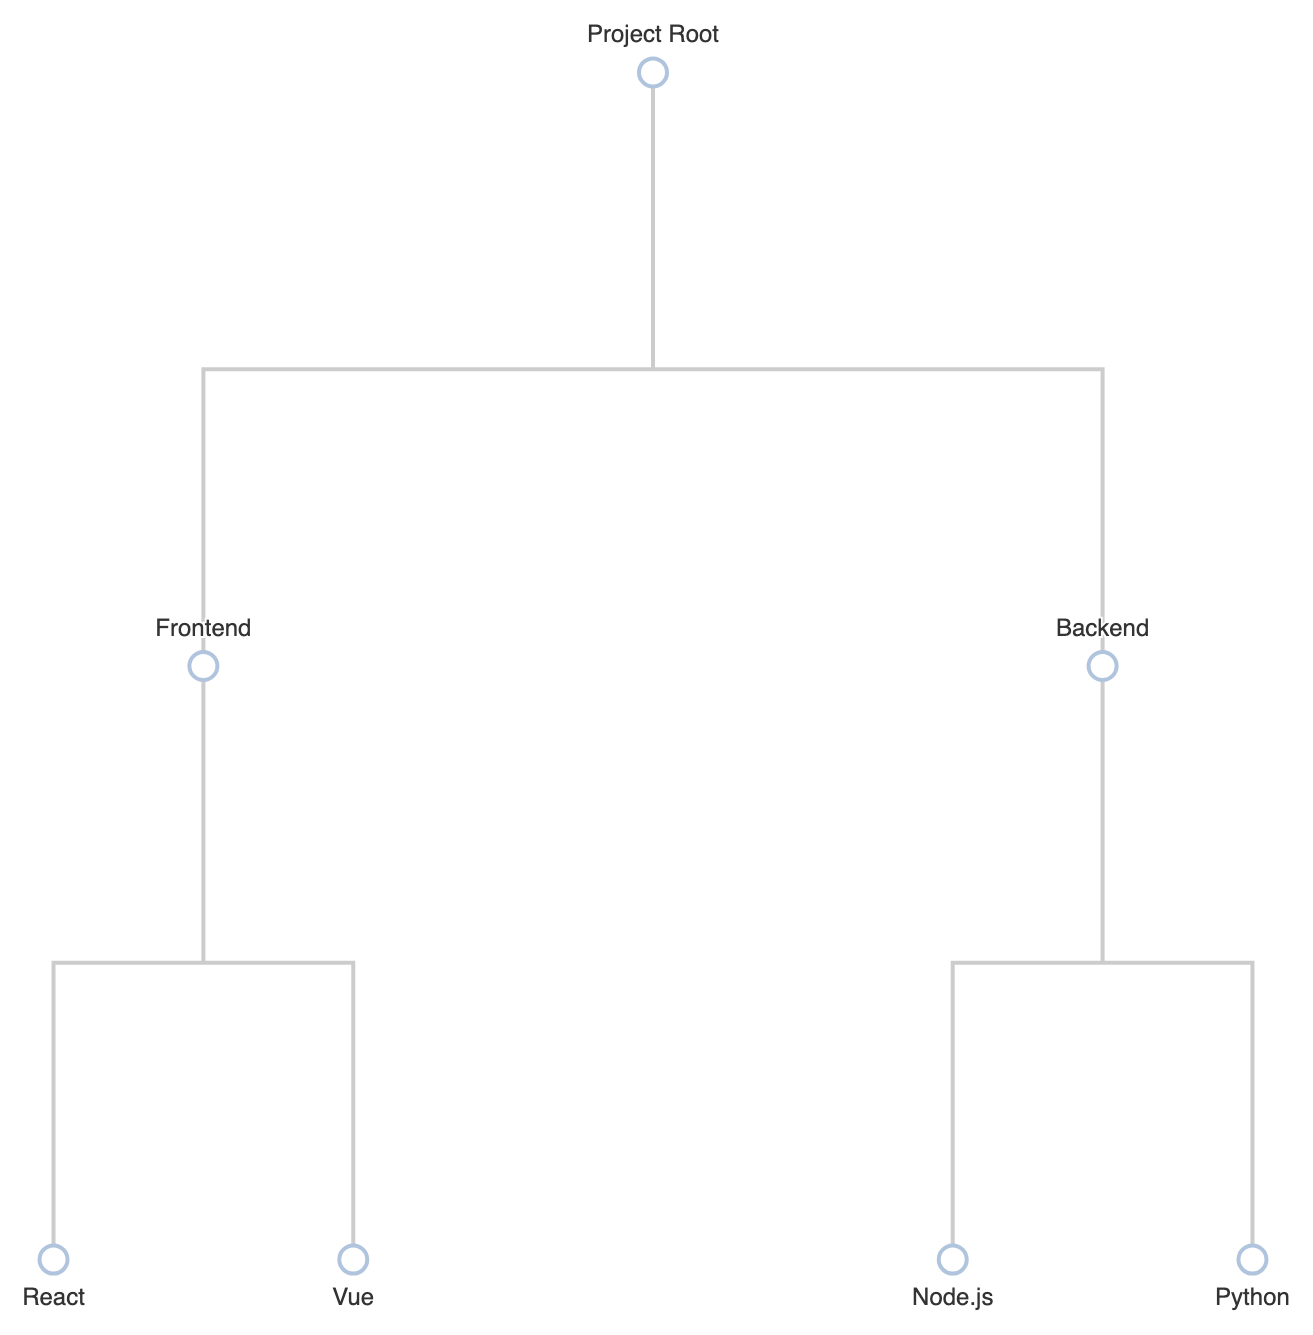
Use lineStyle.curveness to smooth connection lines, and define levels array configs to style nodes according to their depth in the hierarchy:
option = {
    tooltip: {
        trigger: 'item'
    },
    series: [
        {
            type: 'tree',
            orient: 'TB', // Top to Bottom orientation
            data: [{
                name: 'Project Root',
                children: [
                    {
                        name: 'Frontend',
                        children: [
                            { name: 'React' },
                            { name: 'Vue' }
                        ]
                    },
                    {
                        name: 'Backend',
                        children: [
                            { name: 'Node.js' },
                            { name: 'Python' }
                        ]
                    }
                ]
            }],
            top: '10%',
            left: '10%',
            bottom: '10%',
            right: '10%',
            symbol: 'emptyCircle',
            symbolSize: 14,
            edgeShape: 'polyline', // Uses crisp rectangular connections instead of curves
            initialTreeDepth: 2,
            lineStyle: {
                width: 2,
                color: '#ccc'
            },
            label: {
                position: 'top',
                fontSize: 12
            },
            leaves: {
                label: {
                    position: 'bottom'
                }
            }
        }
    ]
};
Strategic Best Practices
- Control Initial Collapse Depth: Set
initialTreeDepth(e.g.,1or2) on large datasets to keep the chart clean on initial load while letting users click nodes to expand details. - Choose the Right Orientation: Use horizontal (`LR`) or radial (`radial`) layouts for deep nested structures with long label text, and vertical (`TB`) layouts for shallow, wide org structures.
- Differentiate Leaf Nodes: Use the
leavesproperty to style end-nodes differently from parent container nodes so users can easily distinguish branches from endpoints.