


When presenting multi-level hierarchical datasets or displaying large visual breakdowns where space is at a premium, the Treemap Chart provides an efficient visual solution. By tiling nested rectangles into a unified bounding area, treemaps encode numerical values through rectangle area size, allowing users to evaluate relative proportions across complex nested structures—such as disk space usage, product catalog revenue, or budget allocations across parent and child departments.
The Mechanics of Treemap Charts
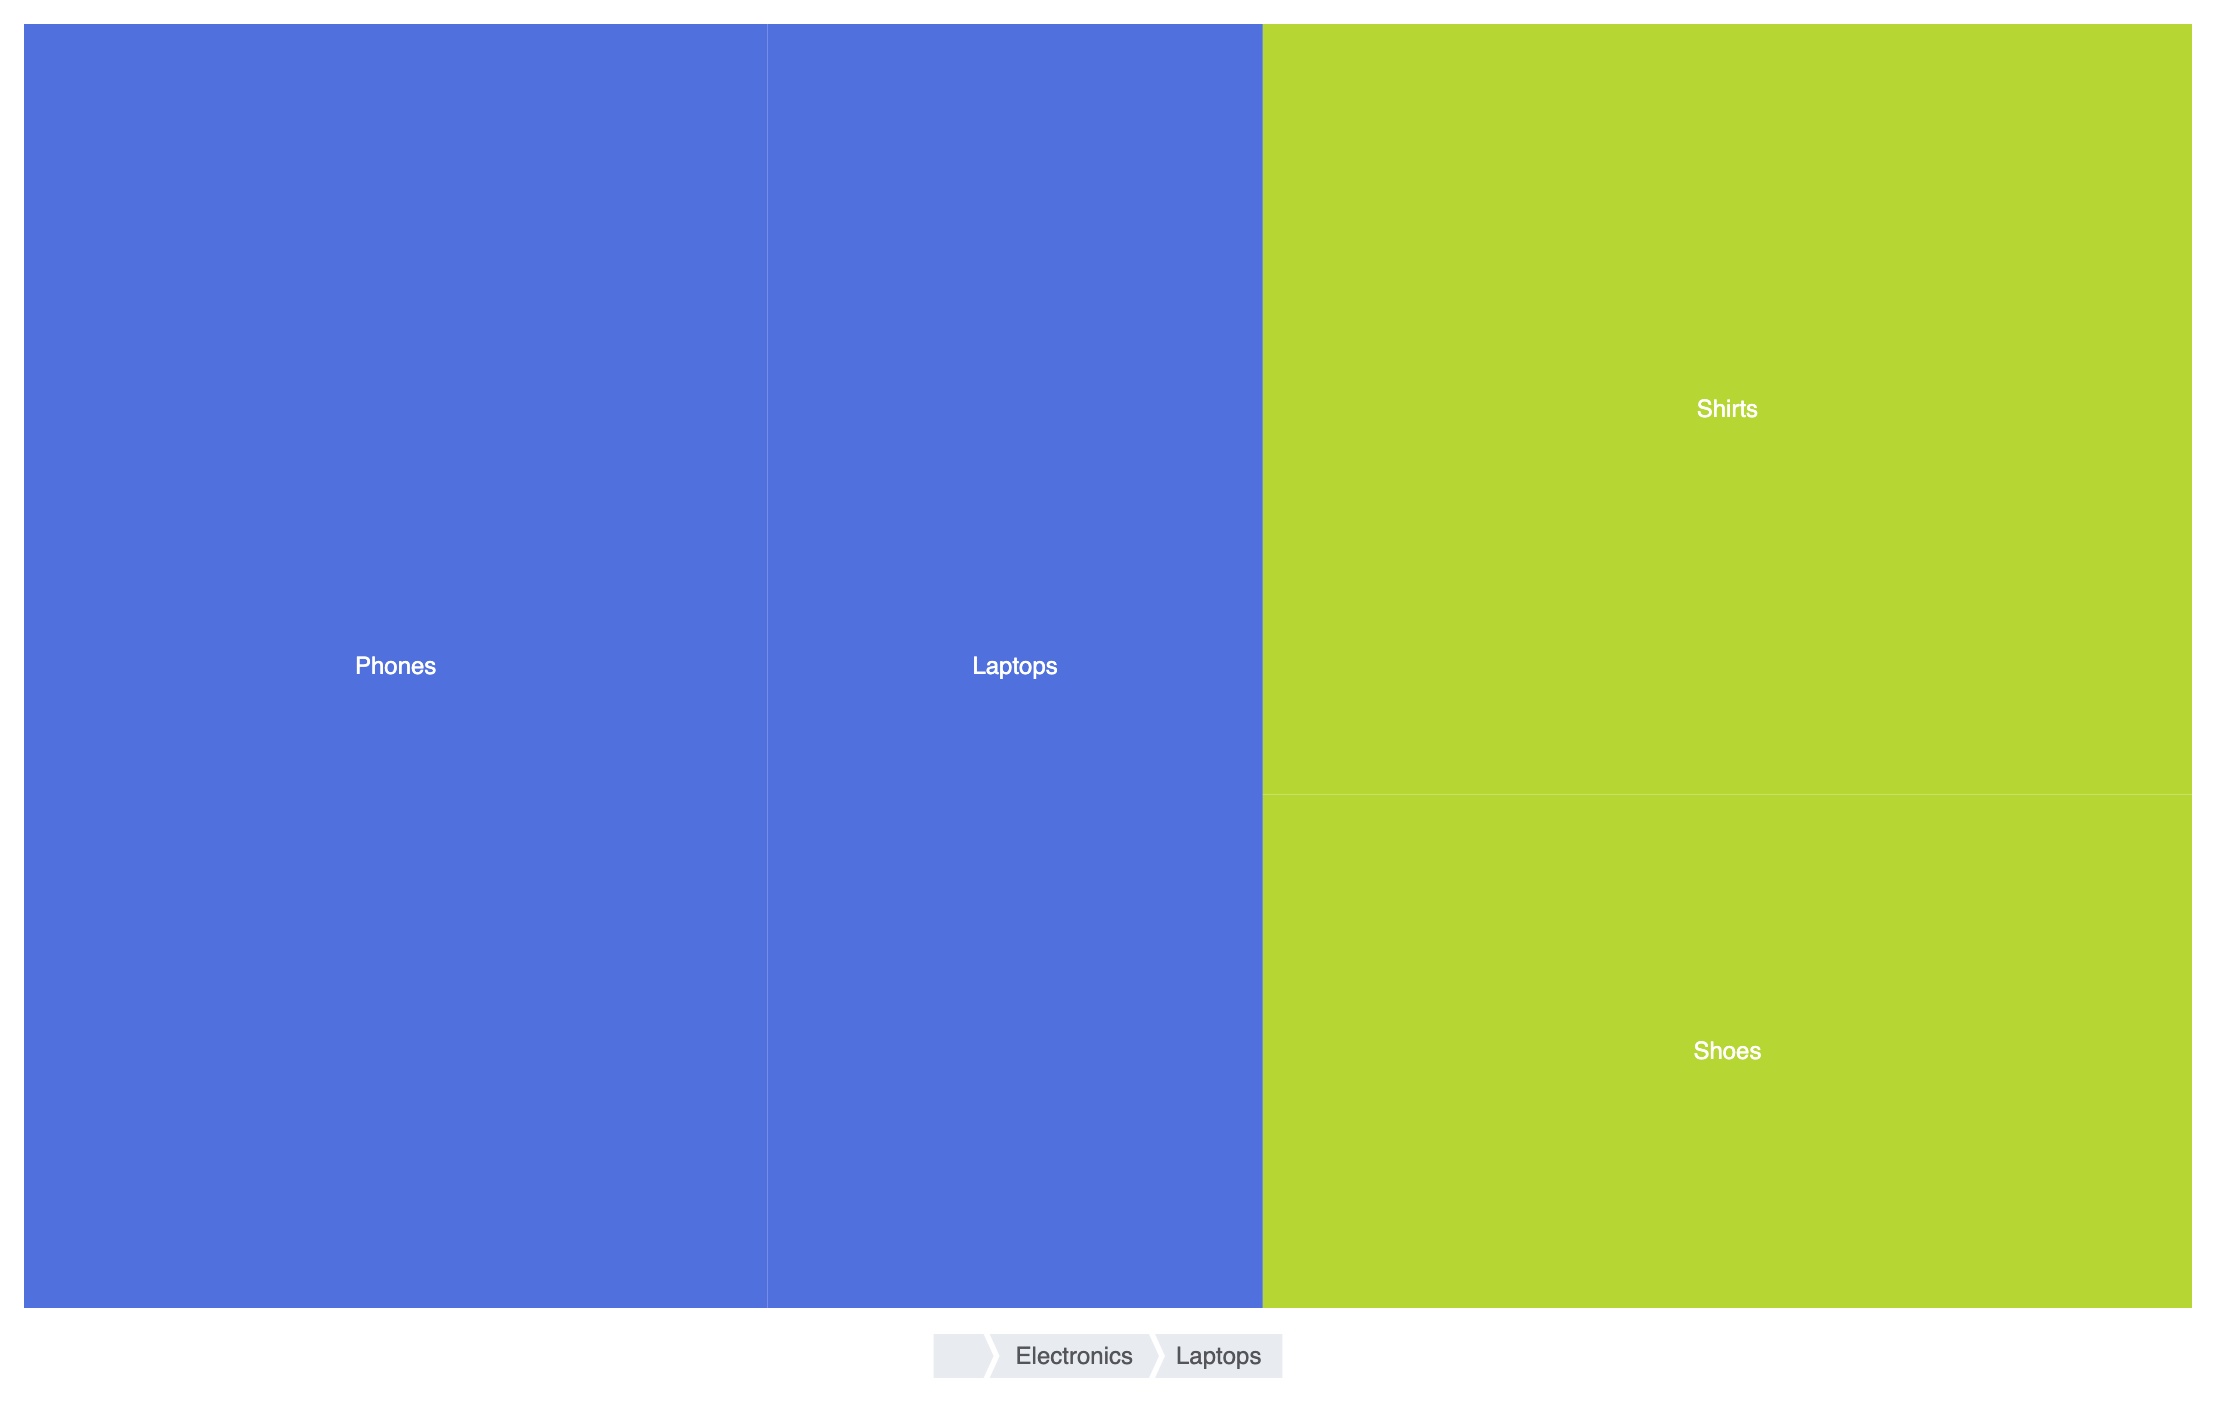
In Apache ECharts, treemaps use type: 'treemap'. The series expects a tree-structured data array where each object contains a name, a quantitative value, and an optional children array for deeper nested levels.
1. Essential Setup
To construct a basic treemap, define a hierarchical data array with nested children and set type: 'treemap' inside your series configuration:
option = {
    tooltip: {
        formatter: '{b}: ${c}'
    },
    series: [
        {
            type: 'treemap',
            data: [
                {
                    name: 'Electronics',
                    value: 400,
                    children: [
                        { name: 'Phones', value: 240 },
                        { name: 'Laptops', value: 160 }
                    ]
                },
                {
                    name: 'Apparel',
                    value: 300,
                    children: [
                        { name: 'Shirts', value: 180 },
                        { name: 'Shoes', value: 120 }
                    ]
                }
            ]
        }
    ]
};
Advanced Structural Techniques
Treemaps can be configured with multi-level styling rules, color gradient mappings, and interactive drill-down controls for deep data trees.
1. Multi-Level Breadcrumb Drill-Down
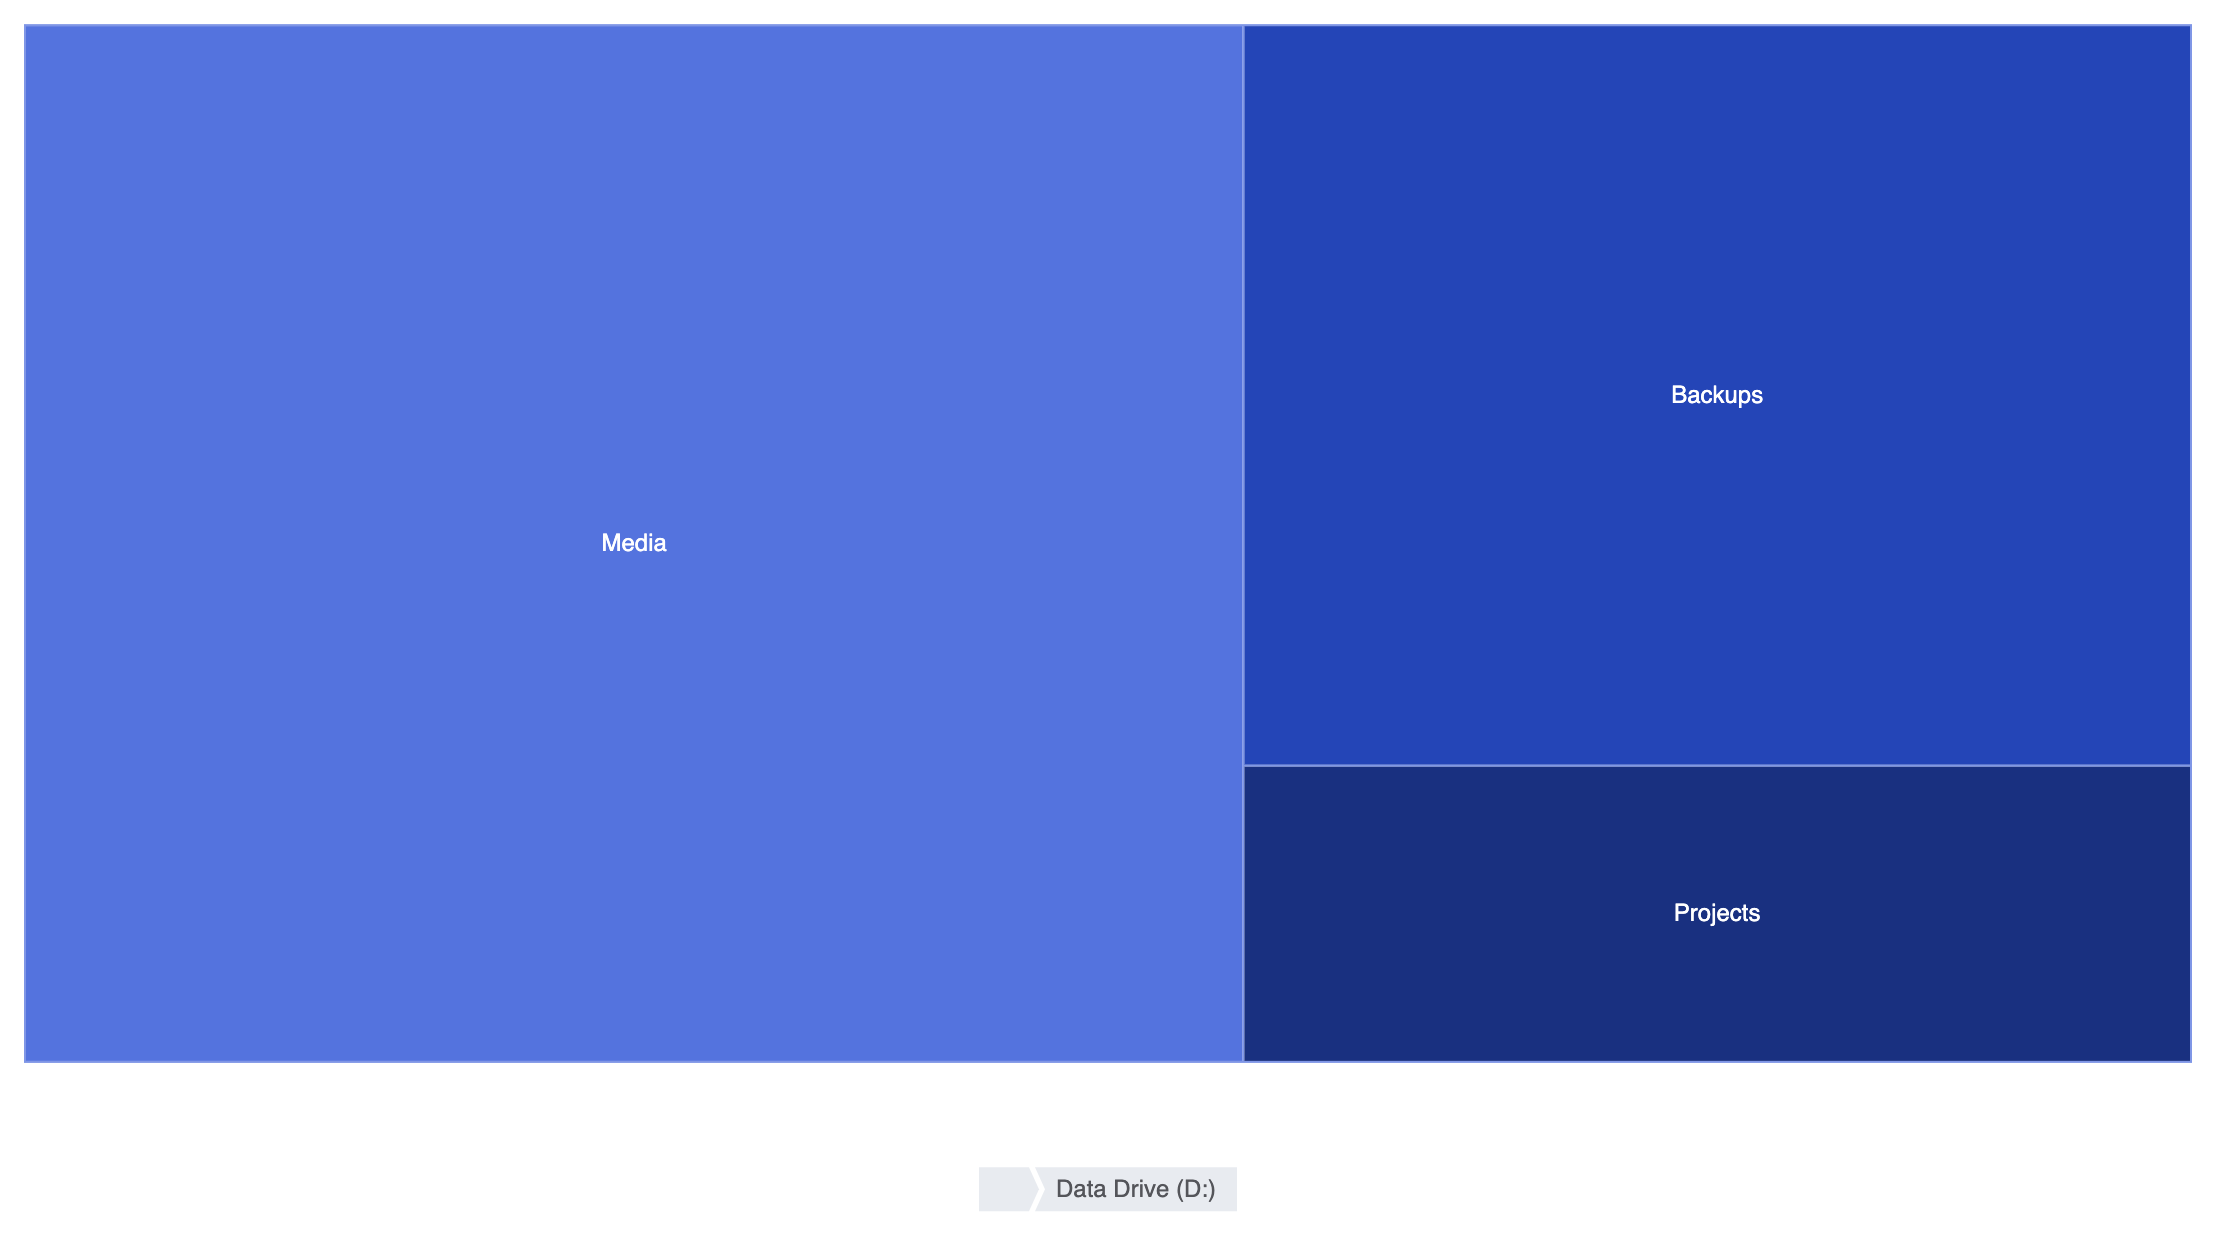
Enable top legends and breadcrumb navigation to allow users to identify top-level categories and navigate smoothly into nested sub-directories:
option = {
    tooltip: {
        trigger: 'item',
        formatter: '{b}: {c} GB'
    },
    legend: {
        top: '5%',
        left: 'center',
        data: ['System Drive (C:)', 'Data Drive (D:)']
    },
    series: [
        {
            type: 'treemap',
            top: '18%',
            bottom: '12%',
            leafDepth: 1, // Shows one level at a time with click-to-drill-down
            breadcrumb: {
                show: true,
                left: 'center',
                bottom: '2%'
            },
            levels: [
                {
                    itemStyle: {
                        borderColor: '#555',
                        borderWidth: 2,
                        gapWidth: 2
                    }
                },
                {
                    colorSaturation: [0.3, 0.6],
                    itemStyle: {
                        borderWidth: 1,
                        gapWidth: 1,
                        borderColorSaturation: 0.7
                    }
                }
            ],
            data: [
                {
                    name: 'System Drive (C:)',
                    value: 500,
                    children: [
                        { name: 'Windows', value: 120 },
                        { name: 'Program Files', value: 230 },
                        { name: 'Users', value: 150 }
                    ]
                },
                {
                    name: 'Data Drive (D:)',
                    value: 800,
                    children: [
                        { name: 'Media', value: 450 },
                        { name: 'Backups', value: 250 },
                        { name: 'Projects', value: 100 }
                    ]
                }
            ]
        }
    ]
};
Fine-Tuning Layout and Styling
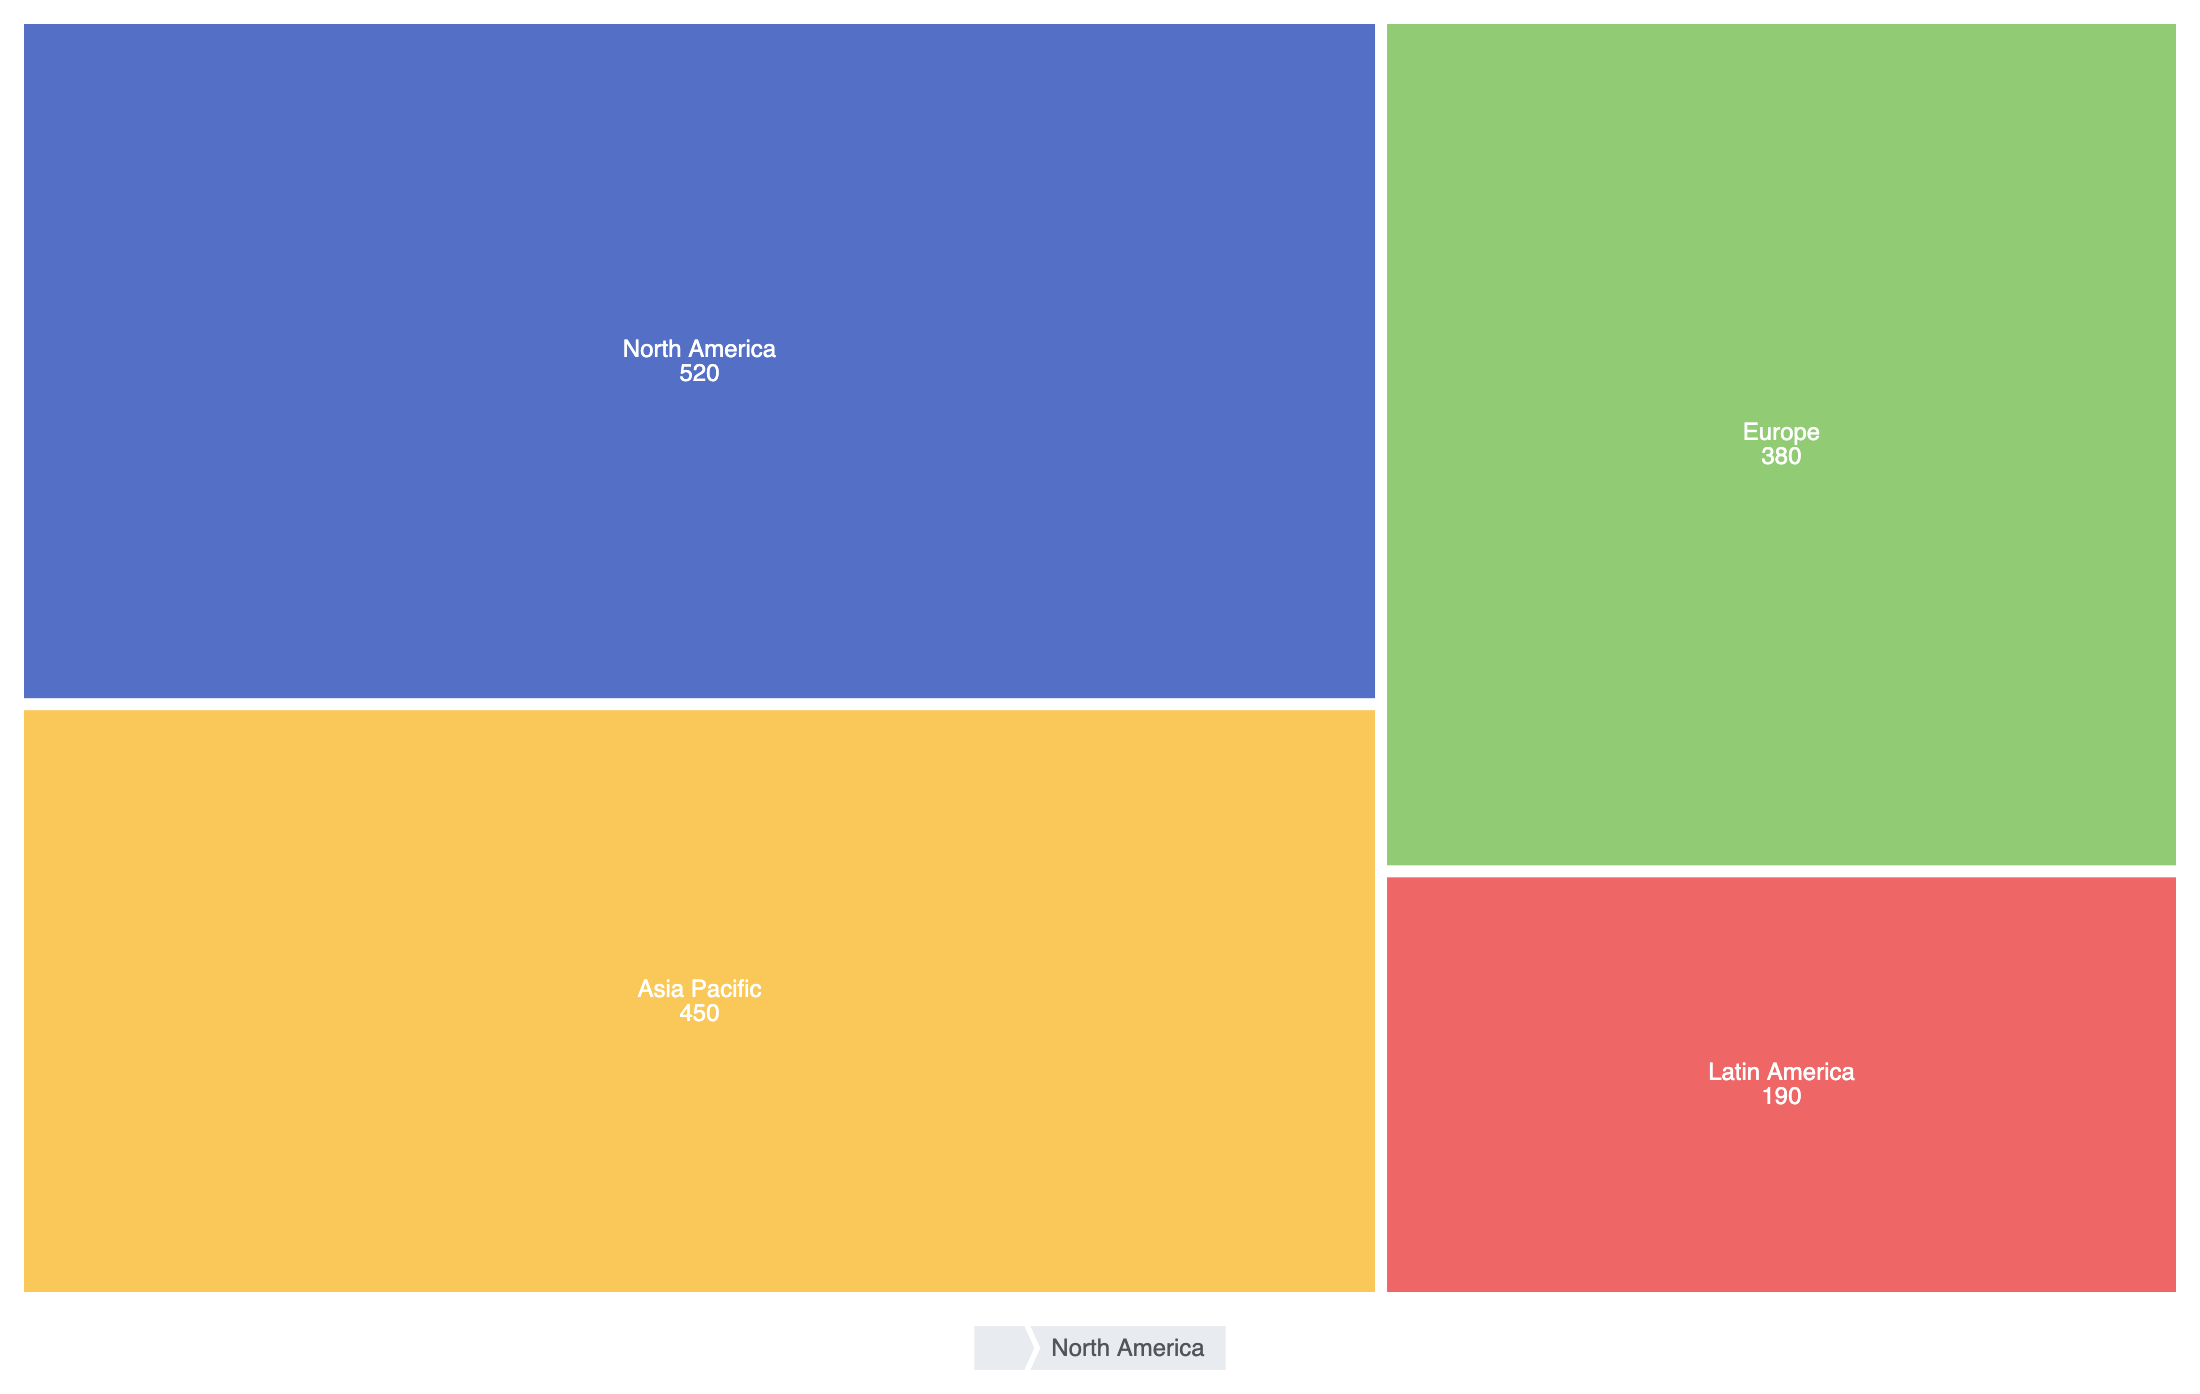
Applying gap widths, clean borders, and distinct level colors keeps nested rectangles organized and visually readable.
1. Custom Cell Borders and Label Alignment
Tweak gapWidth and label configurations to maintain distinct boundaries between parent containers and child segments:
option = {
    series: [
        {
            type: 'treemap',
            roam: false, // Disables manual zooming/panning
            label: {
                show: true,
                formatter: '{b}\n{c}'
            },
            itemStyle: {
                borderColor: '#ffffff',
                borderWidth: 2,
                gapWidth: 2
            },
            data: [
                {
                    name: 'North America',
                    value: 520,
                    itemStyle: { color: '#5470c6' }
                },
                {
                    name: 'Europe',
                    value: 380,
                    itemStyle: { color: '#91cc75' }
                },
                {
                    name: 'Asia Pacific',
                    value: 450,
                    itemStyle: { color: '#fac858' }
                },
                {
                    name: 'Latin America',
                    value: 190,
                    itemStyle: { color: '#ee6666' }
                }
            ]
        }
    ]
};
Strategic Best Practices
- Use
gapWidthfor Nesting Visibility: Adding a smallgapWidth(e.g., 2px to 4px) between nested rectangles creates clear spacing between parent categories and child sub-items. - Enable Breadcrumbs for Deep Hierarchies: When displaying 3 or more nested levels, enable `breadcrumb: { show: true }` so users can easily trace their location and navigate back up.
- Keep Labels Concise: Text can easily spill over small leaf rectangles. Combine short names with tooltips or use
leafDepthto hide tiny sub-rectangles until zoomed in.