


當繪製相互連接的網路、結構層次或複雜實體關係時,圖表(或網路圖)是理想的視覺框架。透過將項目顯示為節點,連接顯示為有向或無向連結,圖表可讓使用者探索群集、依賴樹與關係流而標準的表格圖表無法傳達的內容——例如微服務架構、社交網路互動或知識圖譜。
圖表的運作機制
在 Apache ECharts 中,圖表使用type: 'graph'。與直接將數值映射到水平與垂直軸座標不同,圖表會採用明確的節點(或data)與links(或邊。ECharts 隨後會使用固定座標配置、環形佈局或動態的力導向物理引擎來排列這些節點。
1. 基本設定
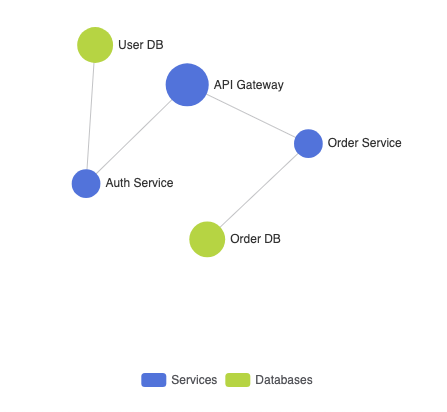
要使用力導向物理建立基本的網路圖,請在data中宣告您的節點,在links中設定連接,並設定layout: 'force':
ECharts
在 VPasCode 中編輯 ECharts
ECharts
Edit ECharts in VPasCode
option = {
    tooltip: {},
    legend: {
        data: ['服務', '資料庫']
    },
    series: [
        {
            name: '系統網路',
            type: 'graph',
            layout: 'force',
            roam: true, // 允許縮放與拖曳
            label: {
                show: true,
                position: 'right'
            },
            force: {
                repulsion: 100,
                edgeLength: 80
            },
            data: [
                { id: '0', name: 'API 網關', symbolSize: 30, category: 0 },
                { id: '1', name: '驗證服務', symbolSize: 20, category: 0 },
                { id: '2', name: '訂單服務', symbolSize: 20, category: 0 },
                { id: '3', name: '使用者資料庫', symbolSize: 25, category: 1 },
                { id: '4', name: '訂單資料庫', symbolSize: 25, category: 1 }
            ],
            links: [
                { source: '0', target: '1' },
                { source: '0', target: '2' },
                { source: '1', target: '3' },
                { source: '2', target: '4' }
            ],
            categories: [
                { name: '服務' },
                { name: '資料庫' }
            ]
        }
    ]
};
進階結構技術
圖表支援其他佈局引擎,例如環形排列或有向箭頭,以清晰顯示資料依賴關係。
1. 帶有有向連結箭頭的環形佈局
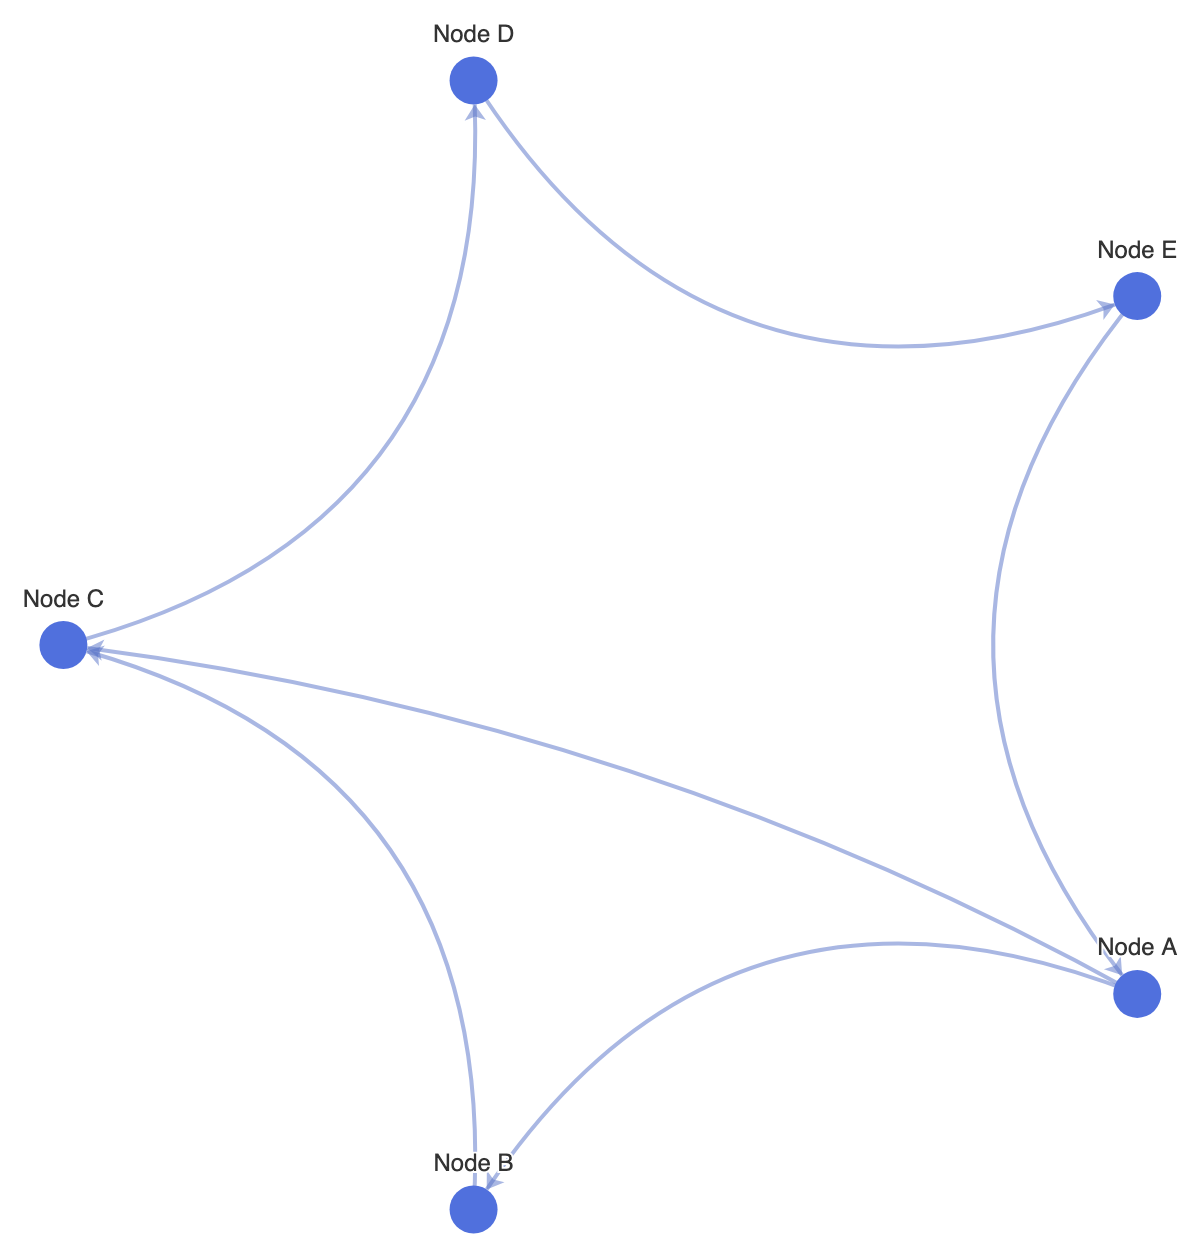
設定 layout: 'circular'以將節點整理成整潔的環形結構,並啟用邊線箭頭以顯示元件之間的方位關係:
ECharts
在 VPasCode 中編輯 ECharts
ECharts
Edit ECharts in VPasCode
option = {
    tooltip: {},
    series: [
        {
            type: 'graph',
            layout: 'circular',
            roam: true,
            label: {
                show: true,
                position: 'outside'
            },
            edgeSymbol: ['none', 'arrow'], // 在連結端點繪製箭頭
            edgeSymbolSize: [0, 8],
            data: [
                { id: 'A', name: '節點 A', symbolSize: 24 },
                { id: 'B', name: '節點 B', symbolSize: 24 },
                { id: 'C', name: '節點 C', symbolSize: 24 },
                { id: 'D', name: '節點 D', symbolSize: 24 },
                { id: 'E', name: '節點 E', symbolSize: 24 }
            ],
            links: [
                { source: 'A', target: 'B' },
                { source: 'B', target: 'C' },
                { source: 'C', target: 'D' },
                { source: 'D', target: 'E' },
                { source: 'E', target: 'A' },
                { source: 'A', target: 'C' }
            ],
            lineStyle: {
                color: '#5470c6',
                width: 2,
                curveness: 0.2 // 曲線連接線以避免重疊
            }
        }
    ]
};
微調佈局與節點樣式
調整邊線曲率、節點邊框陰影與互動選項,可確保密集網路群組在互動式網頁上仍具可讀性。
1. 自訂節點類別顏色與力學物理
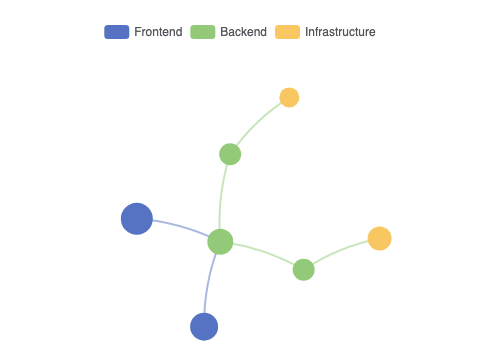
調整排斥值與線條樣式,以建立結構清晰、視覺上分離的群組:
ECharts
在 VPasCode 中編輯 ECharts
ECharts
Edit ECharts in VPasCode
option = {
    legend: {
        top: '5%',
        left: 'center'
    },
    series: [
        {
            type: 'graph',
            layout: 'force',
            roam: true,
            draggable: true,
            force: {
                repulsion: 250,
                gravity: 0.1,
                edgeLength: [50, 100]
            },
            categories: [
                { name: '前端', itemStyle: { color: '#5470c6' } },
                { name: '後端', itemStyle: { color: '#91cc75' } },
                { name: '基礎設施', itemStyle: { color: '#fac858' } }
            ],
            data: [
                { name: 'Web 應用', category: 0, symbolSize: 32 },
                { name: '行動應用', category: 0, symbolSize: 28 },
                { name: 'API 網關', category: 1, symbolSize: 26 },
                { name: '微服務 A', category: 1, symbolSize: 22 },
                { name: '微服務 B', category: 1, symbolSize: 22 },
                { name: 'Redis 快取', category: 2, symbolSize: 20 },
                { name: 'PostgreSQL', category: 2, symbolSize: 24 }
            ],
            links: [
                { source: 'Web 應用', target: 'API 網關' },
                { source: '行動應用', target: 'API 網關' },
                { source: 'API 網關', target: '微服務 A' },
                { source: 'API 網關', target: '微服務 B' },
                { source: '微服務 A', target: 'Redis 快取' },
                { source: '微服務 B', target: 'PostgreSQL' }
            ],
            lineStyle: {
                color: 'source', // 根據來源節點顏色設定邊線顏色
                width: 2,
                curveness: 0.1
            }
        }
    ]
};
戰略最佳實務
- 啟用
roam: true以進行導航:互動式網路會快速擴張。啟用縮放與拖曳導航功能,讓使用者能專注於特定群組,而不會感到擁擠。 - 套用
曲率至邊線:設定輕微曲率(例如,lineStyle.curveness: 0.1至0.2) 防止兩個相同節點之間的雙向連結重疊成單一線條。 - 平衡力物理排斥: 調整
force.repulsion請小心調整。數值過低會導致節點重疊成密集的群組,而數值過高則會將節點完全推離可見畫布。