


The Mechanics of DOT Clusters
The DOT language treats subgraphs and clusters differently. To create a Cluster, your subgraph identifier must begin with the prefixcluster_. This is a mandatory syntax requirement; if you omit this prefix, the layout engine will treat the group as a simple logical grouping without the visual border or background fill.
Why Clusters Matter for Architecture
Clusters serve as the “scope” of your documentation. By nesting components within a cluster, you communicate to your reader that these elements share a common environment, security zone, or lifecycle. This is essential for:- Multi-Cloud Visualization: Grouping nodes by VPC, region, or availability zone.
- Microservice Isolation: Showing which services belong to which functional domain.
- Security Audits: Visually demonstrating which components reside within a protected perimeter (e.g., a “DMZ” cluster).
Advanced Cluster Configuration
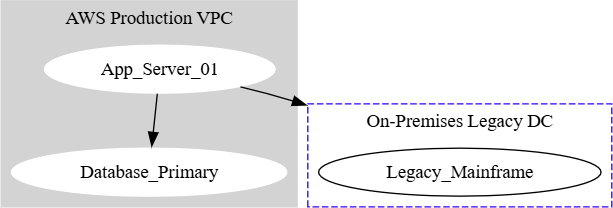
Clusters support the full array of Graphviz attributes, allowing you to style the container itself. You can set a background color, a border style, and a descriptive label to ensure the cluster acts as a formal part of the documentation.
Graphviz
Edit Graphviz in VPasCode
digraph EnterpriseCloud {
    // Global graph settings
    compound=true; // Necessary for edges to span between clusters

    subgraph cluster_aws_vpc {
        label = "AWS Production VPC";
        style = filled;
        color = lightgrey;
        node [style=filled, color=white];

        "App_Server_01" -> "Database_Primary";
    }

    subgraph cluster_on_prem {
        label = "On-Premises Legacy DC";
        style = dashed;
        color = blue;

        "Legacy_Mainframe";
    }

    // Edge crossing cluster boundaries
    "App_Server_01" -> "Legacy_Mainframe" [lhead=cluster_on_prem];
}
Strategic Cluster Best Practices
- Enable
compound=true: When working with clusters, always setcompound=trueat the top level of your digraph. This enables thelhead(logical head) andltail(logical tail) attributes, allowing you to draw edges that start or end exactly on the edge of a cluster box, rather than inside it. - Maintain Visual Hierarchy: Use color and style consistently. For example, use a soft background fill for “Cloud” clusters and a dashed border for “Legacy” or “Temporary” infrastructure. This allows users to scan the diagram and immediately understand the architectural landscape.
- Don’t Over-Nest: While Graphviz supports deep nesting of clusters (clusters within clusters), aim to limit your nesting to two or three levels maximum. Over-nesting leads to complex edge routing calculations that can make the diagram difficult to interpret.
- Labels are Mandatory: Never leave a cluster unnamed. A unlabeled bounding box is ambiguous; a labeled cluster acts as a definitive context marker for everything inside it.