


Basic Syntax Structure
Every pie chart starts with thepie declaration. You can optionally include a title, followed by data entries where category labels are wrapped in quotation marks and paired with positive numerical values.
Mermaid
Edit Mermaid in VPasCode
pie
title Sample Pie Chart
"Category A" : 45
"Category B" : 30
"Category C" : 25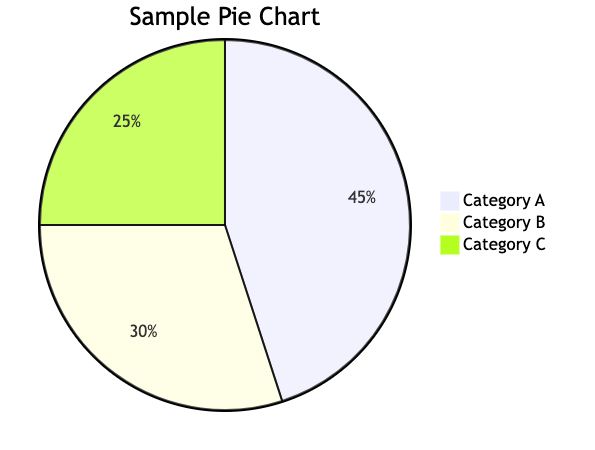
Syntax Reference
The table below breaks down the core structural options used to construct a pie chart map in Mermaid.js.| Component | Description | Syntax Example |
|---|---|---|
| Declaration | Initializes the pie chart rendering engine. | pie |
| Show Data Flag | An optional modifier added immediately after pie to display actual numbers alongside calculated percentages. |
pie showData |
| Title | An optional heading printed clearly above the center of the diagram layout. | title Q3 Revenue Sources |
| Data Entry Label | The category name, which must always be enclosed in double quotation marks. | "Organic Search" |
| Data Separator | A colon character separating your label string from its mathematical value. | : |
| Data Value | A positive number. Supports absolute counts or direct decimal weights up to two decimal spaces. | 54.25 |
Real-World Blueprint: Website Traffic Sources
This blueprint showcases a classic marketing and analytics dashboard breakdown. It uses theshowData parameter to explicitly display the raw traffic metrics directly inside the legend while the chart presents the layout proportions.
Mermaid
Edit Mermaid in VPasCode
pie showData title Core Traffic Channels
"Organic Search" : 3540
"Direct Traffic" : 2410
"Social Media" : 1850
"Referral Sites" : 920
"Email Campaigns" : 680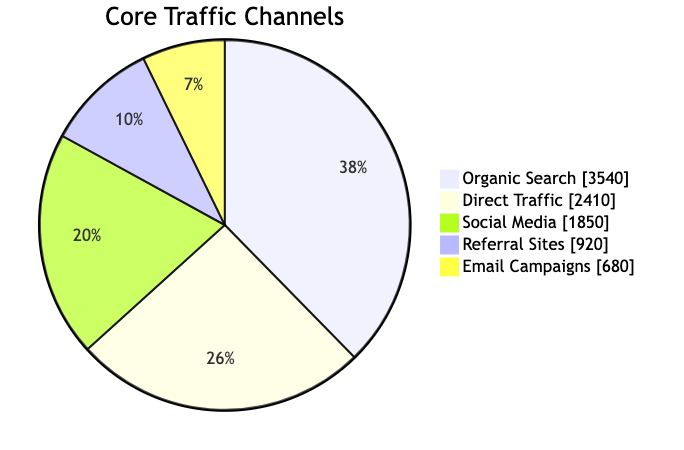
Syntax Tip: By default, Mermaid displays only the relative calculated percentages (e.g., 35%) over each chart section. Adding the
showData keyword immediately after pie changes the labels to show both the percentage on the chart and the exact raw values inside the accompanying legend list.
Advanced Concept: Directives & Formatting
For high-density documentation pages, you can apply an inline configuration directive at the top of your code snippet to customize styling behaviors, change text placement offsets, or modify structural line styles.
Mermaid
Edit Mermaid in VPasCode
---
config:
  pie:
    textPosition: 0.6
  themeVariables:
    pieOuterStrokeWidth: "3px"
---
pie title Operational Budget Allocation
"Product Development" : 40.5
"Marketing & Growth" : 25.25
"Customer Operations" : 20.0
"Administrative Overhead" : 14.25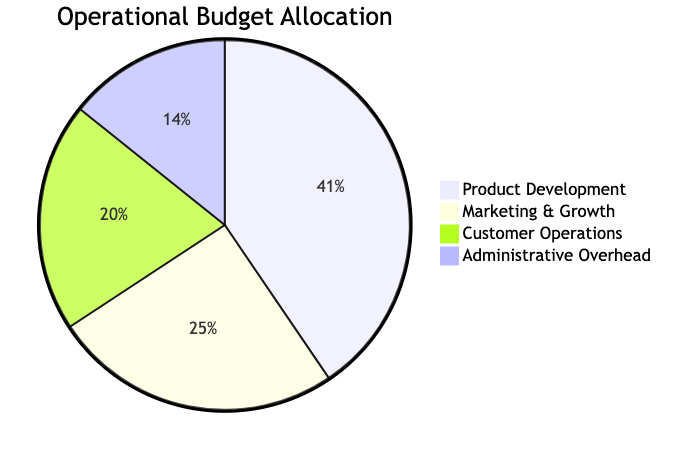
Common Syntax Pitfalls
While pie charts have one of the simplest syntaxes in Mermaid, a few formatting mistakes will cause layout parsing failures. Avoid these common errors:- Negative Numbers: The rendering engine only accepts positive numeric values. Passing a negative value or zero will break the math processing boundaries.
- Quotation Requirements: Data category labels must always use double quotation marks. Single quotes or missing quotes will fail to build properly.
- Decimal Precision Limits: While Mermaid handles precise floating-point decimals smoothly, it natively tracks parameters up to two decimal places. Rounding values beforehand maintains strict consistency.
- Slice Densities: For clean visual communication, it is best practice to limit your charts to 6–8 slices. If your datasets have more elements, group smaller nodes together under an “Others” category to keep your design scannable.