


1. Core Structure
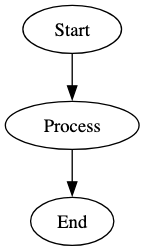
Every Graphviz flowchart starts with a graph declaration wrapped in curly braces ({ }). Use digraph (directed graph) for flowcharts that require directional arrows. Each statement inside the graph ends with a semicolon (;).
Graphviz
Edit Graphviz in VPasCode
digraph Flowchart {
    // Basic directional flow
    Start -> Process -> End;
}
2. Layout & Orientation Settings
Global options configured at the top of your script control how the flowchart renders across the page.| Setting | Command | Description |
|---|---|---|
| Rank Direction | rankdir=TB; |
Top to bottom flow (default) |
| Horizontal Flow | rankdir=LR; |
Left to right flow |
| Node Separation | nodesep=0.5; |
Space between adjacent nodes |
| Rank Separation | ranksep=0.8; |
Space between levels or ranks |
Graphviz
Edit Graphviz in VPasCode
digraph HorizontalFlow {
    rankdir=LR;
    node [fontname="Arial"];

    Step1 -> Step2 -> Step3;
}
3. Customising Shapes and Nodes
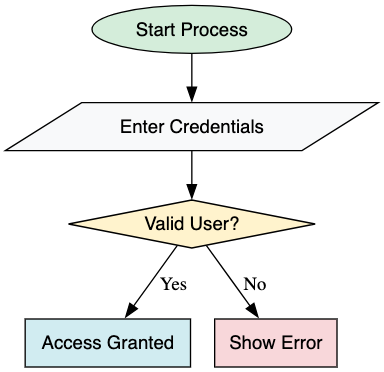
Nodes represent individual steps, decision points, or endpoints. You can customize their shape, background color, and text font using square brackets ([...]).
Common Flowchart Shapes
| Flowchart Element | Shape Name | Graphviz Syntax Example |
|---|---|---|
| Start / End | oval or ellipse |
node [shape=oval]; |
| Process / Action | box or rectangle |
node [shape=box]; |
| Decision Point | diamond |
node [shape=diamond]; |
| Input / Output | parallelogram |
node [shape=parallelogram]; |
| Database / Storage | cylinder |
node [shape=cylinder]; |
Graphviz
Edit Graphviz in VPasCode
digraph NodeStyles {
    node [fontname="Helvetica", style=filled, fillcolor="#F8F9FA"];

    start   [label="Start Process", shape=oval, fillcolor="#D4EDDA"];
    input   [label="Enter Credentials", shape=parallelogram];
    check   [label="Valid User?", shape=diamond, fillcolor="#FFF3CD"];
    success [label="Access Granted", shape=box, fillcolor="#D1ECF1"];
    error   [label="Show Error", shape=box, fillcolor="#F8D7DA"];

    start -> input;
    input -> check;
    check -> success [label="Yes"];
    check -> error   [label="No"];
}
4. Edge Styling & Branching Connections
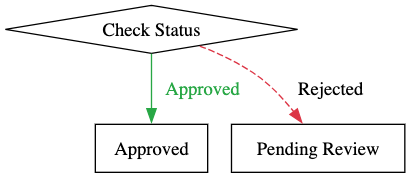
Edges represent the connector arrows between nodes. You can customize labels, colors, and line styles (e.g., dashed vs solid) to indicate specific logic branches.
Graphviz
Edit Graphviz in VPasCode
digraph EdgeFormatting {
    A [label="Check Status", shape=diamond];
    B [label="Approved", shape=box];
    C [label="Pending Review", shape=box];

    // Customizing edge labels and styles
    A -> B [label=" Approved ", color="#28A745", fontcolor="#28A745", weight=2];
    A -> C [label=" Rejected ", color="#DC3545", style=dashed];
}
5. Subgraphs & Clusters (Groupings)
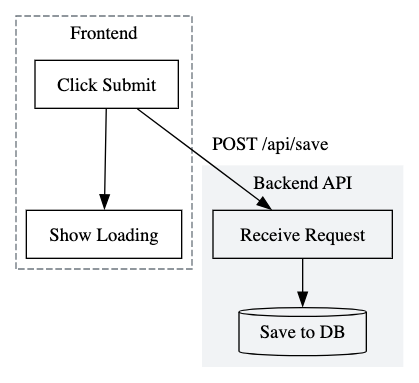
Use subgraphs to partition processes into visual clusters or swimlanes. To render a visible box around the grouped nodes, the subgraph identifier must begin with the prefixcluster_.
Graphviz
Edit Graphviz in VPasCode
digraph Swimlanes {
    rankdir=TB;
    compound=true;

    // Frontend cluster
    subgraph cluster_frontend {
        label = "Frontend";
        style = dashed;
        color = "#6C757D";

        user_click [label="Click Submit", shape=box];
        show_spinner [label="Show Loading", shape=box];
    }

    // Backend cluster
    subgraph cluster_backend {
        label = "Backend API";
        style = filled;
        color = "#F1F3F5";

        api_req [label="Receive Request", shape=box];
        db_save [label="Save to DB", shape=cylinder];
    }

    user_click -> show_spinner;
    user_click -> api_req [label="POST /api/save"];
    api_req -> db_save;
}
6. Complete Practical Example
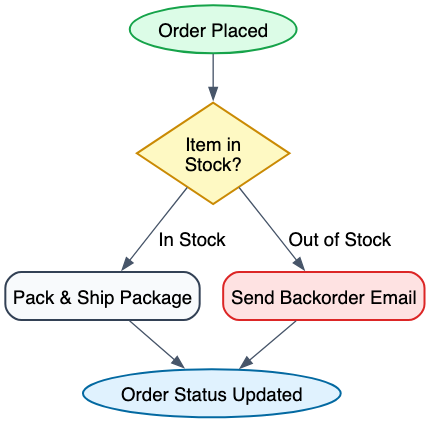
The following example demonstrates an order fulfillment workflow featuring explicit node styling, line breaks (\n), decision branching, custom border weights, and distinct status color schemes.
Graphviz
Edit Graphviz in VPasCode
digraph OrderFulfillment {
    fontname="Helvetica,Arial,sans-serif"
    node [fontname="Helvetica,Arial,sans-serif", shape=box, style="filled,rounded", color="#334155", fillcolor="#f8fafc", penwidth=1.5]
    edge [fontname="Helvetica,Arial,sans-serif", color="#475569", arrowsize=0.9]
    rankdir=TB;

    Start       [shape=oval, label="Order Placed", fillcolor="#dcfce7", color="#16a34a", style="filled"]
    CheckStock  [shape=diamond, label="Item in\nStock?", fillcolor="#fef9c3", color="#ca8a04", style="filled"]
    PackOrder   [label="Pack & Ship Package"]
    NotifyUser  [label="Send Backorder Email", fillcolor="#fee2e2", color="#dc2626"]
    End         [shape=oval, label="Order Status Updated", fillcolor="#e0f2fe", color="#0369a1", style="filled"]

    Start -> CheckStock;
    CheckStock -> PackOrder  [label=" In Stock "];
    CheckStock -> NotifyUser [label=" Out of Stock "];
    PackOrder -> End;
    NotifyUser -> End;
}
Conclusion
Graphviz DOT language offers a concise, declarative way to generate clear, well-structured flowcharts without manual layout tweaking. By applying consistent global node and edge attributes, defining distinct shapes for decision steps, and grouping system components into subgraphs, you can turn complex logic into easy-to-read diagrams that stay maintainable directly inside your code or documentation.