


1. Core Hierarchy Structure
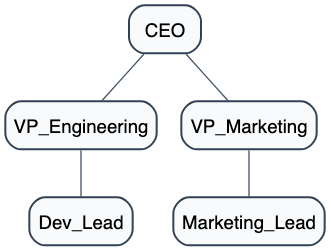
An org chart is structured using a directed graph (digraph). Hierarchy is defined naturally by creating directional links (->) from managers down to their direct reports.
Graphviz
Edit Graphviz in VPasCode
digraph BasicOrgChart {
    fontname="Helvetica,Arial,sans-serif"
    node [fontname="Helvetica,Arial,sans-serif", shape=box, style="filled,rounded", color="#334155", fillcolor="#f8fafc", penwidth=1.5]
    edge [fontname="Helvetica,Arial,sans-serif", color="#475569", arrowsize=0.8, dir=none]
    rankdir=TB;

    CEO -> VP_Engineering;
    CEO -> VP_Marketing;
    VP_Engineering -> Dev_Lead;
    VP_Marketing -> Marketing_Lead;
}
2. Layout & Alignment Settings
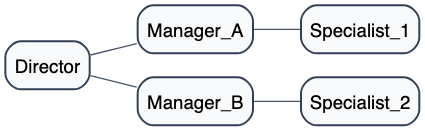
Use global graph attributes to control the direction, vertical spacing, and arrow visibility in your reporting hierarchy.| Setting | Command | Description |
|---|---|---|
| Top-to-Bottom Flow | rankdir=TB; |
Standard vertical organizational layout |
| Left-to-Right Flow | rankdir=LR; |
Horizontal reporting structure layout |
| Remove Arrows | edge [arrowhead=none]; |
Hides arrowheads for clean tree connector lines |
| Orthogonal Lines | splines=ortho; |
Renders right-angled connector lines |
Graphviz
Edit Graphviz in VPasCode
digraph HorizontalOrg {
    fontname="Helvetica,Arial,sans-serif"
    node [fontname="Helvetica,Arial,sans-serif", shape=box, style="filled,rounded", color="#334155", fillcolor="#f8fafc", penwidth=1.5]
    edge [fontname="Helvetica,Arial,sans-serif", color="#475569", arrowhead=none]
    rankdir=LR;

    Director -> Manager_A -> Specialist_1;
    Director -> Manager_B -> Specialist_2;
}
3. Node Customisation & Roles
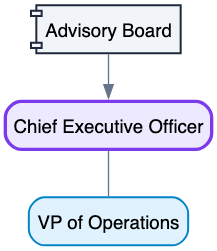
You can customize individual nodes with names, job titles, background colors, custom shapes, and border highlights using square brackets ([...]). Line breaks (\n) allow clean separation between names and titles.
Common Org Chart Node Styles
| Role Level | Visual Treatment | Graphviz Syntax Example |
|---|---|---|
| Governing Body | Component shape, light background | fillcolor="#f1f5f9", shape=component |
| Executive / Leadership | Accent border, prominent color | fillcolor="#ede9fe", color="#7c3aed", penwidth=2.5 |
| Department Head | Highlight border, distinct fill | fillcolor="#e0f2fe", color="#0284c7" |
| Operational Lead | Standard rounded card | fillcolor="#f8fafc", color="#1e293b" |
Graphviz
Edit Graphviz in VPasCode
digraph StyledNodes {
    fontname="Helvetica,Arial,sans-serif"
    node [fontname="Helvetica,Arial,sans-serif", shape=box, style="filled,rounded", color="#1e293b", fillcolor="#f8fafc", penwidth=1.5]
    edge [fontname="Helvetica,Arial,sans-serif", color="#64748b", arrowhead=none]

    Board [label="Advisory Board", fillcolor="#f1f5f9", shape=component]
    CEO   [label="Chief Executive Officer", fillcolor="#ede9fe", color="#7c3aed", penwidth=2.5]
    VP    [label="VP of Operations", fillcolor="#e0f2fe", color="#0284c7"]

    Board -> CEO [style=solid, arrowhead=normal];
    CEO -> VP;
}
4. Aligning Peer Levels (rank=same)
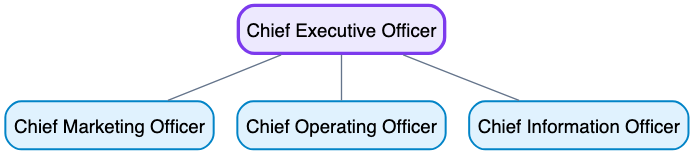
By default, Graphviz places connected nodes on sequential levels. To force colleagues or peers onto the exact same horizontal tier, group them inside a { rank=same; ... } block.
Graphviz
Edit Graphviz in VPasCode
digraph PeerAlignment {
    fontname="Helvetica,Arial,sans-serif"
    node [fontname="Helvetica,Arial,sans-serif", shape=box, style="filled,rounded", color="#1e293b", fillcolor="#f8fafc", penwidth=1.5]
    edge [fontname="Helvetica,Arial,sans-serif", color="#64748b", arrowhead=none]

    CEO [label="Chief Executive Officer", fillcolor="#ede9fe", color="#7c3aed", penwidth=2.5]

    // Force leadership peers onto the same horizontal rank
    { rank=same; CMO; COO; CIO; }

    CMO [label="Chief Marketing Officer", fillcolor="#e0f2fe", color="#0284c7"]
    COO [label="Chief Operating Officer", fillcolor="#e0f2fe", color="#0284c7"]
    CIO [label="Chief Information Officer", fillcolor="#e0f2fe", color="#0284c7"]

    CEO -> CMO;
    CEO -> COO;
    CEO -> CIO;
}
5. Department Clusters & Subgraphs
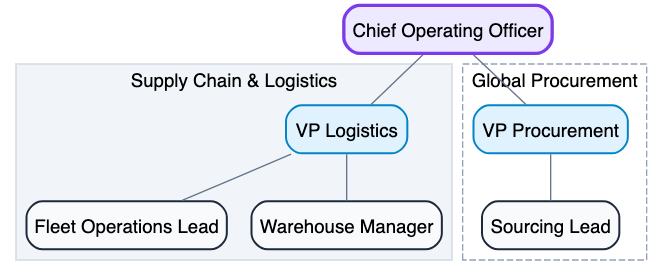
Use subgraphs to visually partition teams into departmental containers or divisions. The subgraph identifier must begin with the prefixcluster_ to display a surrounding box.
Graphviz
Edit Graphviz in VPasCode
digraph DepartmentClusters {
    fontname="Helvetica,Arial,sans-serif"
    node [fontname="Helvetica,Arial,sans-serif", shape=box, style="filled,rounded", color="#1e293b", fillcolor="#f8fafc", penwidth=1.5]
    edge [fontname="Helvetica,Arial,sans-serif", color="#64748b", arrowhead=none]
    rankdir=TB;

    COO [label="Chief Operating Officer", fillcolor="#ede9fe", color="#7c3aed", penwidth=2.5]

    subgraph cluster_logistics {
        label = "Supply Chain & Logistics";
        style = "filled";
        fillcolor = "#f1f5f9";
        color = "#cbd5e1";

        VP_Logistics [label="VP Logistics", fillcolor="#e0f2fe", color="#0284c7"];
        Fleet_Mgr    [label="Fleet Operations Lead"];
        Warehouse    [label="Warehouse Manager"];

        VP_Logistics -> Fleet_Mgr;
        VP_Logistics -> Warehouse;
    }

    subgraph cluster_procurement {
        label = "Global Procurement";
        style = "dashed";
        color = "#94a3b8";

        VP_Procure [label="VP Procurement", fillcolor="#e0f2fe", color="#0284c7"];
        Sourcing   [label="Sourcing Lead"];

        VP_Procure -> Sourcing;
    }

    COO -> VP_Logistics;
    COO -> VP_Procure;
}
6. Complete Practical Example
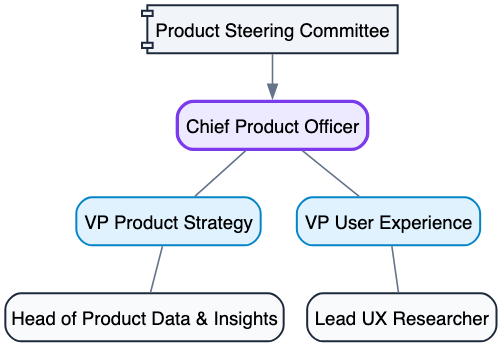
The following example demonstrates a multi-tier product, design, and analytics structure featuring governance nodes, leadership hierarchy, and operational sub-departments using exact DOT formatting practices.
Graphviz
Edit Graphviz in VPasCode
digraph ProductOrganization {
    fontname="Helvetica,Arial,sans-serif"
    rankdir=TB;
    node [fontname="Helvetica,Arial,sans-serif", shape=box, style="filled,rounded", color="#1e293b", fillcolor="#f8fafc", penwidth=1.5]
    edge [color="#64748b", arrowhead=none, penwidth=1.2]

    SteeringComm [label="Product Steering Committee", fillcolor="#f1f5f9", shape=component]
    CPO          [label="Chief Product Officer", fillcolor="#ede9fe", color="#7c3aed", penwidth=2.5]
    VPProduct    [label="VP Product Strategy", fillcolor="#e0f2fe", color="#0284c7"]
    VPDesign     [label="VP User Experience", fillcolor="#e0f2fe", color="#0284c7"]
    HeadAnalytics[label="Head of Product Data & Insights"]
    LeadUXR      [label="Lead UX Researcher"]

    SteeringComm -> CPO [style=solid, arrowhead=normal]
    CPO -> VPProduct;
    CPO -> VPDesign;
    VPProduct -> HeadAnalytics;
    VPDesign -> LeadUXR;
}
Conclusion
Building organizational charts with Graphviz DOT language gives you a maintainable, code-driven approach to visualising company structures. By leveraging clear rank directions, custom node styles,rank=same peer alignment, and departmental subgraphs, you can easily map out simple team trees or multi-tiered corporate hierarchies that update seamlessly alongside your documentation.