


The Mechanics of Calendar Charts
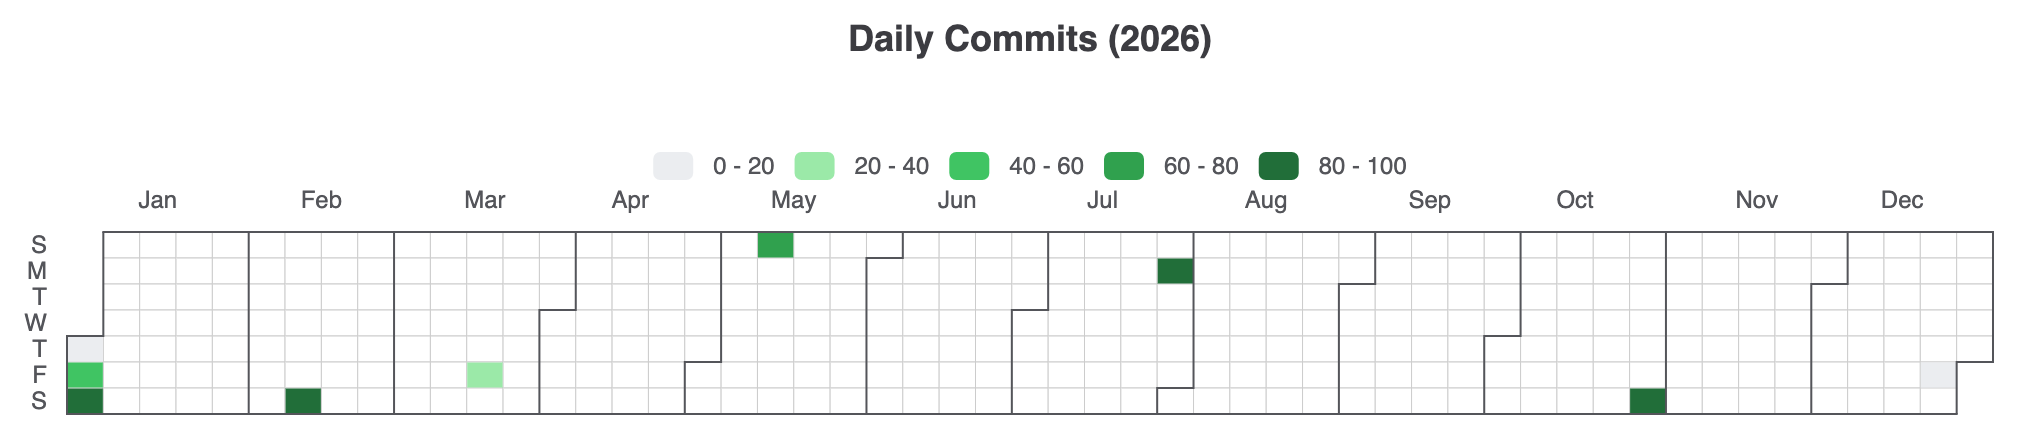
In Apache ECharts, calendar charts use a dedicatedcalendar coordinate system combined with a heatmap or scatter series type. Instead of standard cartesian X and Y axes, ECharts calculates day and month grid positions automatically using date strings.
1. Essential Setup
To create a basic annual calendar heatmap, define acalendar component specifying a range (e.g., '2026'), attach a visualMap to control metric color gradients, and pass daily date-value tuples formatted as ['YYYY-MM-DD', value]:
ECharts
Edit ECharts in VPasCode
option = {
    title: {
        top: 10,
        left: 'center',
        text: 'Daily Commits (2026)'
    },
    tooltip: {
        formatter: function (params) {
            return params.value[0] + ': ' + params.value[1] + ' commits';
        }
    },
    visualMap: {
        min: 0,
        max: 100,
        type: 'piecewise',
        orient: 'horizontal',
        left: 'center',
        top: 65,
        inRange: {
            color: ['#ebedf0', '#9be9a8', '#40c463', '#30a14e', '#216e39']
        }
    },
    calendar: {
        top: 120,
        left: 30,
        right: 30,
        cellSize: ['auto', 13],
        range: '2026',
        itemStyle: {
            borderWidth: 0.5,
            borderColor: '#ccc'
        },
        yearLabel: { show: false }
    },
    series: {
        type: 'heatmap',
        coordinateSystem: 'calendar',
        data: [
            ['2026-01-01', 12], ['2026-01-02', 45], ['2026-01-03', 88],
            ['2026-02-14', 95], ['2026-03-20', 30], ['2026-05-10', 65],
            ['2026-07-27', 82], ['2026-10-31', 99], ['2026-12-25', 10]
        ]
    }
};
Advanced Structural Techniques
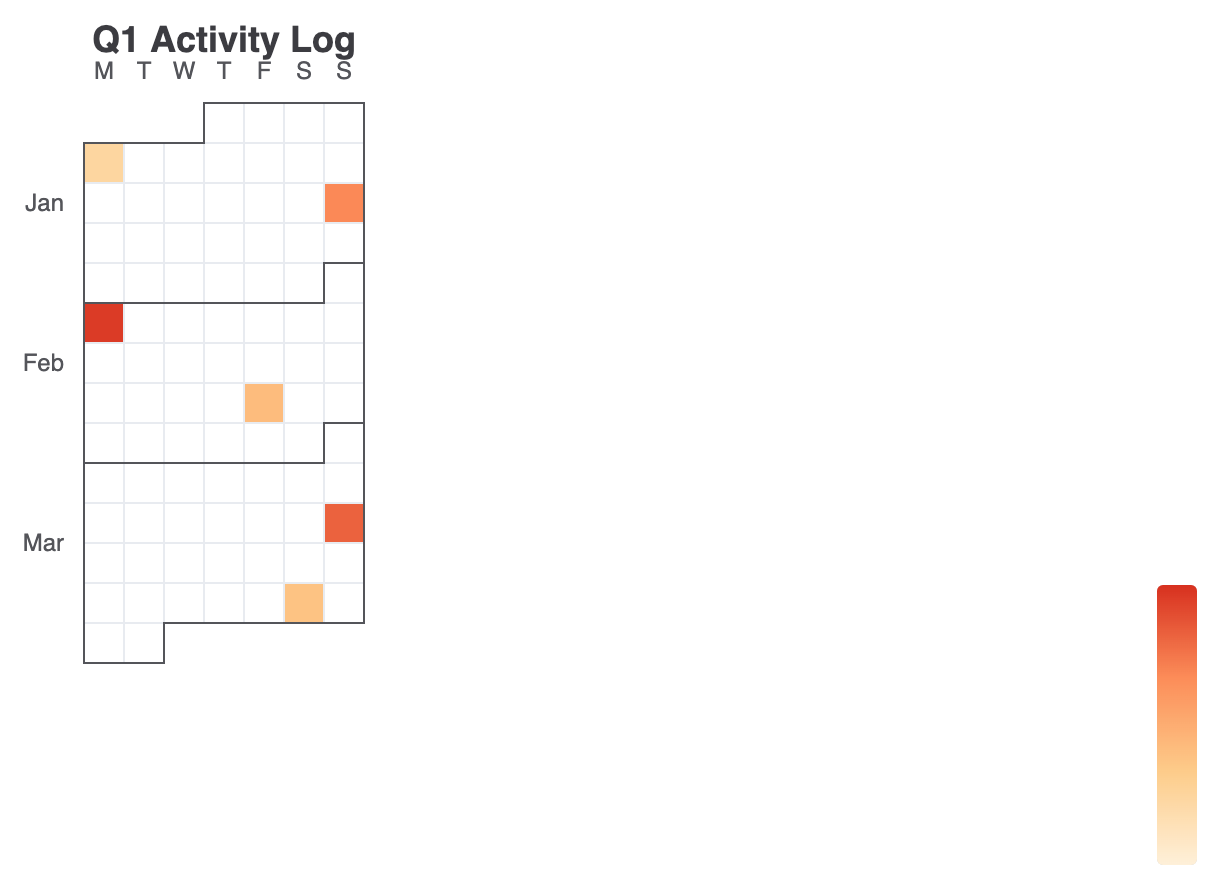
Calendar charts can be adapted for vertical scrolling layouts or customized with scatter representations to visualize discrete daily metrics.1. Vertical Multi-Month Calendar View
Changeorient: 'vertical' on the calendar component to stack months vertically—ideal for tall dashboard widgets or mobile layouts:
ECharts
Edit ECharts in VPasCode
option = {
    title: {
        text: 'Q1 Activity Log',
        left: 'center'
    },
    tooltip: {},
    visualMap: {
        min: 0,
        max: 500,
        type: 'continuous',
        orient: 'vertical',
        right: 10,
        top: 'center',
        inRange: {
            color: ['#fef0d9', '#fdcc8a', '#fc8d59', '#d7301f']
        }
    },
    calendar: {
        top: 60,
        left: 'center',
        orient: 'vertical',
        range: ['2026-01-01', '2026-03-31'],
        cellSize: [20, 20],
        yearLabel: { show: false },
        dayLabel: {
            firstDay: 1, // Start week on Monday
            nameMap: 'en'
        },
        monthLabel: { nameMap: 'en' }
    },
    series: {
        type: 'heatmap',
        coordinateSystem: 'calendar',
        data: [
            ['2026-01-05', 120], ['2026-01-18', 340], ['2026-02-02', 480],
            ['2026-02-20', 210], ['2026-03-15', 410], ['2026-03-28', 190]
        ]
    }
};
Fine-Tuning Layout and Styling
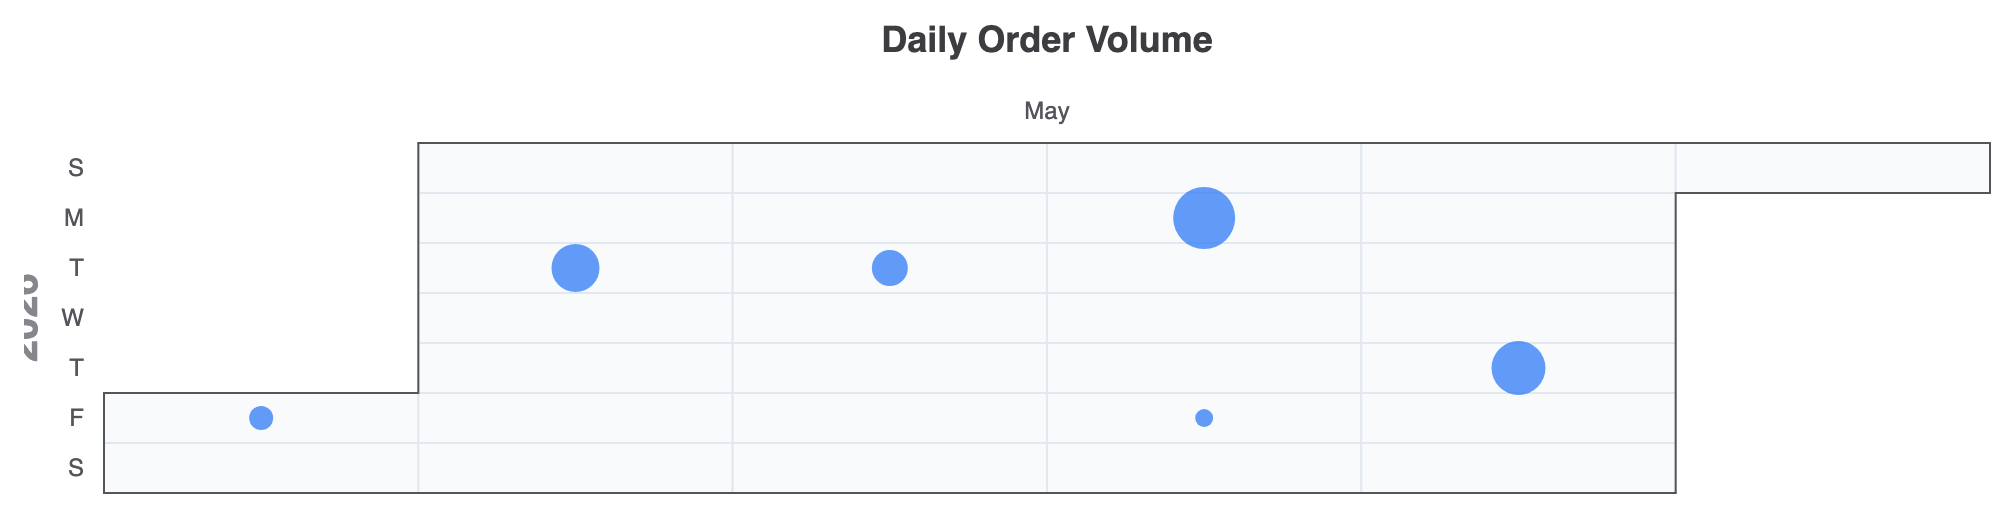
Combining calendar coordinate systems with scatter series allows you to scale point sizes based on intensity instead of color blocks alone.1. Scatter Bubble Calendar
Usingtype: 'scatter' on a calendar coordinate system creates interactive bubble-style daily indicators:
ECharts
Edit ECharts in VPasCode
option = {
    title: {
        text: 'Daily Order Volume',
        left: 'center'
    },
    tooltip: {
        formatter: function (params) {
            return params.value[0] + ': ' + params.value[1] + ' orders';
        }
    },
    calendar: {
        top: 80,
        left: 40,
        right: 40,
        range: '2026-05',
        cellSize: ['auto', 25],
        itemStyle: {
            color: '#f8fafc',
            borderWidth: 1,
            borderColor: '#e2e8f0'
        }
    },
    series: {
        type: 'scatter',
        coordinateSystem: 'calendar',
        symbolSize: function (val) {
            return val[1] / 10; // Scales bubble size according to order count
        },
        itemStyle: {
            color: '#3b82f6',
            opacity: 0.8
        },
        data: [
            ['2026-05-01', 120], ['2026-05-05', 240], ['2026-05-12', 180],
            ['2026-05-18', 310], ['2026-05-22', 90], ['2026-05-28', 270]
        ]
    }
};
Strategic Best Practices
- Match Dates to ISO Format: Ensure dates inside your series data array follow standard
'YYYY-MM-DD'string formats so the calendar grid maps records accurately. - Configure
firstDayfor Regional Consistency: UsedayLabel.firstDay(set to0for Sunday or1for Monday) to match your audience’s local calendar conventions. - Pair Piecewise VisualMap for Contributions: When rendering GitHub-style commit graphs, use a
piecewisevisual map type with discrete color stops rather than continuous gradients for cleaner categorical visual steps.