


What is a Component Diagram?
A Component Diagram is a structural UML diagram that maps out the high-level modular organization of a software system. As a vital component of the Unified Modeling Language (UML) specification, this specific UML diagram type visualizes how physical code modules, libraries, microservices, execution packages, and database layers are structurally grouped and interconnected. It shifts the documentation focus away from fine-grained class definitions, allowing software architects and principal engineers to illustrate system integration boundaries, API orchestration paths, and third-party dependencies clearly. Whether you are outlining a modern cloud-native microservice topology or showing how an internal framework library hooks into your legacy application core, a UML component map provides a clear, structural overview of system boundaries. With VPasCode, your component layouts are rendered automatically based on declarative text, eliminating the hassle of manually adjusting layout boxes or connector wires.Core Syntax Guide: Elements and Constructs
To design an elegant, standards-compliant UML component diagram in PlantUML, you need to master modular code block declarations, interface wiring mechanics, system package groupings, and directional connection parameters.1. Declaring Software Components
You declare a software module using thecomponent keyword. Alternatively, you can wrap a clean text identifier inside square brackets ([Component Name]), which acts as a global shorthand indicator:
PlantUML
Edit PlantUML in VPasCode
component PaymentEngine
[Auth Service] as AuthService
as identifier (like as AuthService) to keep relationship lines clean and readable.
2. Defining Ports and Interfaces
Components interact with one another through structural entry points. You can explicitly model standard UML interfaces (represented visually by a clean “lollipop” circle icon) using theinterface keyword:
PlantUML
Edit PlantUML in VPasCode
interface "REST API v2" as WebAPI
[AuthService] --() WebAPI : "exposes"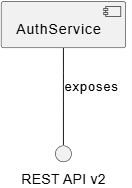
3. Mapping Component Dependencies
To show that one system module relies on or communicates with another, use directional arrows (-->). You can also use standard dotted dependency lines (..>) to represent looser relationships, like message-queue consumption patterns or transient runtime calls:
PlantUML
Edit PlantUML in VPasCode
[Frontend App] --> WebAPI
WebAPI ..> [Database Engine] : "SQL Queries"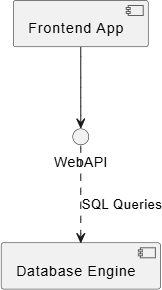
4. Organizing Boundaries with Packages
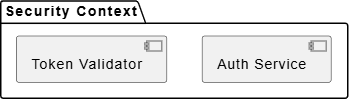
To establish clean sub-system borders or categorize components based on deployment environments, wrap your module blocks inside structuralpackage or cloud wrappers:
PlantUML
Edit PlantUML in VPasCode
package "Security Context" {
    [Auth Service]
    [Token Validator]
}
Best Practices for Clean Component Sub-Systems
- Keep Node Names High-Level: Avoid naming components after specific internal code files or directories. Use functional, high-level names like
[Notification Router]or[Cache Layer]. - Leverage the Lollipop Notation: Instead of drawing plain lines between boxes, route connections through explicit
interfacenodes. This clearly distinguishes *what* interface is being exposed from *who* is consuming it. - Control Layout Expansion: Component maps expand quickly when tracking multiple sub-systems. Use spatial flags inside your dependency arrows (such as
-right->or-down->) to organize your components cleanly across the canvas grid.
Real-World PlantUML Object Diagram Examples
Example 1: Core API Gateway Mesh (Interfaces & Package Groupings)
This boilerplate demonstrates a standard multi-tier system web setup, highlighting how a public user application hooks into internal microservices through structured REST API interfaces.
PlantUML
Edit PlantUML in VPasCode
@startuml
package "Public Presentation Layer" {
    [Web SPA Client] as client
    [Mobile iOS Client] as mobile
}

package "API Gateway Subsystem" {
    interface "HTTPS Gateway Endpoint" as HTTP_GW
    [Kong API Gateway] as gateway
}

package "Core Backend Services" {
    interface "User Management API" as UserAPI
    interface "Billing API" as BillingAPI

    [Identity Service] as auth
    [Payment Processing Engine] as billing
}

' Wire presentation to gateway
client --> HTTP_GW
mobile --> HTTP_GW
HTTP_GW -- gateway

' Wire gateway to backend interfaces
gateway --> UserAPI
gateway --> BillingAPI

UserAPI -- auth
BillingAPI -- billing
@enduml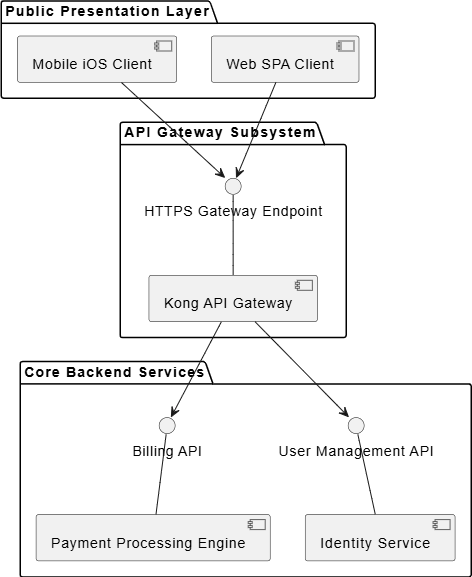
package boundaries, the automated layout engine creates beautifully distinct zones. The presentation clients connect exclusively to the single exposed HTTP_GW gateway port, which then manages internal traffic routing to the specialized backend microservice layers below.
Example 2: Cloud Data Processing Pipeline (Asynchronous Clouds & Queues)
This advanced enterprise blueprint maps a real-world asynchronous cloud data architecture, tracing ingestion pipelines, decoupled message brokers, and physical storage endpoints.
PlantUML
Edit PlantUML in VPasCode
@startuml
cloud "AWS Cloud Network Boundary" {
    [Ingestion Webhook] as webhook
    queue "Apache Kafka Cluster" as broker
    [Stream Processor Event Worker] as worker
    database "Amazon S3 Data Lake" as storage
}

database "Corporate Data Warehouse" as redshift

' Processing pipeline flow mechanics
[External Client App] --> webhook : "POST /telemetry"
webhook -right-> broker : "Publish raw logs"

broker ..> worker : "Consume topic data stream"
worker --> storage : "Write compressed Parquet files"

storage ..> redshift : "Nightly ETL Synchronization"
@enduml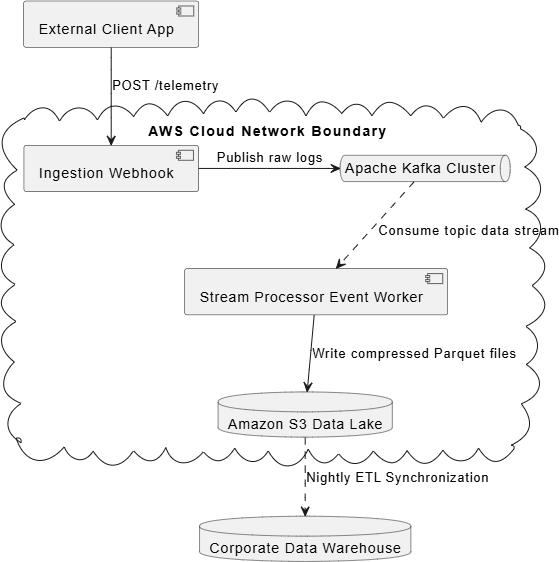
cloud and queue shapes, giving developers immediate visual cues about structural topology. The use of the horizontal arrow override -right-> ensures that data ingestion flows smoothly from left to right across the network grid, while dotted dependencies (..>) accurately represent decoupled, asynchronous communications.