


What is a Gantt Chart?
A Gantt Chart is a project management visualization tool used to map project schedules, task durations, and critical path milestones along a horizontal timeline. By representing work packages as bars and structural dependencies as sequential flows, it allows teams to track progress, identify potential bottlenecks, and communicate deadlines effectively. With Mermaid.js, you define your project schedule using a declarative, text-based syntax. The engine automatically calculates relative bar offsets, handles date-based grid axis scaling, and renders completion percentages, allowing you to generate professional project roadmaps directly inside your documentation.Core Syntax Guide: Elements and Constructs
To design a valid, fully runnable project schedule in Mermaid, you must master the timeline configuration, task declarations, section grouping, and milestone markers.1. Initializing the Gantt Timeline
You initialize a Gantt canvas on line one using thegantt keyword. Every Gantt chart requires a title, a date format definition, and a specific start date to anchor the timeline grid.
gantt
    title Project Alpha Schedule
    dateFormat YYYY-MM-DD
    axisFormat %Y-%m-%d
    excludes weekends
2. Defining Tasks and Durations
Tasks are defined by their status (active, done, or crit), a display label, an internal ID, and a time duration. You can specify a duration using days (d), hours (h), or specific start/end dates.
done: Completed work package.active: Current, in-progress work.crit: Critical path task (renders in a distinct highlight color).
Mermaid
Edit Mermaid in VPasCode
gantt
    section Planning
    Initial Discovery :done, des1, 2026-06-01, 5d
    Requirement Gathering :active, des2, after des1, 7d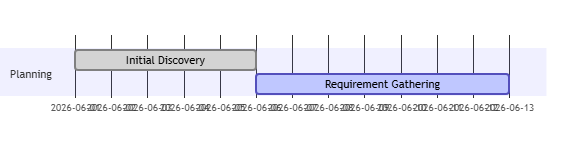
3. Implementing Milestones and Dependencies
Milestones are zero-duration points that mark significant project achievements. Dependencies are established using the task ID, ensuring that the visual bars align correctly when a predecessor finishes.
Mermaid
Edit Mermaid in VPasCode
gantt
    section Release
    Beta Launch :milestone, m1, 2026-07-15, 0d
    Final QA :crit, qa1, after m1, 10d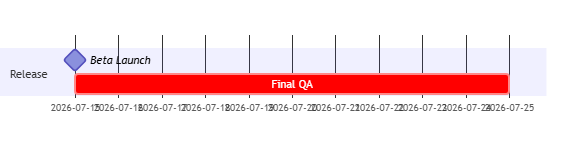
Best Practices for Project Schedules
- Use Descriptive Section Names: Use the
sectionkeyword to group your tasks into logical project phases (e.g., Development, Testing, Deployment). This creates a vertically segmented grid that is much easier to read than a single long list. - Leverage the ‘after’ Keyword: Instead of manually calculating dates, use the
after [task_id]syntax. This ensures that if the project start date shifts, your entire timeline updates automatically without manual editing. - Exclude Non-Working Days: If your project follows a standard business week, include the
excludes weekendsdirective. This keeps your timeline realistic and prevents unrealistic “weekend” work predictions.
Real-World Mermaid Gantt Chart Examples
Example 1: Software Infrastructure Migration Roadmap
This functional blueprint models a multi-stage cloud migration project, utilizing sections to divide architecture planning from implementation and testing.
Mermaid
Edit Mermaid in VPasCode
gantt
    title Cloud Infrastructure Migration Roadmap
    dateFormat YYYY-MM-DD
    axisFormat %m-%d
    excludes weekends

    section Architecture
    Cloud Design   :done, a1, 2026-06-01, 10d
    Security Audit :active, a2, after a1, 5d

    section Migration
    Data Transfer  :crit, m1, after a2, 15d
    App Re-deploy  :m2, after m1, 8d

    section Milestones
    Production Go-Live :milestone, m3, after m2, 0d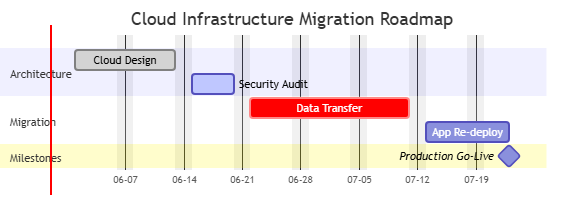
crit, it receives a distinct highlight, drawing the viewer’s attention to the most high-risk phase of the migration.