


What is a Timeline Diagram?
A Timeline Diagram is a chronological visualization tool used to map events or project milestones along a linear temporal path. While Gantt charts handle complex task dependencies and durations, the Timeline diagram focuses on the when—providing a clear, scannable narrative of a project’s evolution or a system’s release cycle. With Mermaid.js, you can define your timeline using a simple, hierarchical text format. The engine automatically handles spacing, formatting of dates or period labels, and the alignment of event markers along the central temporal axis.Core Syntax Guide
To design a valid, runnable timeline, you must define the axis period and map events to specific sections.1. Initializing the Timeline
You initialize the canvas using thetimeline keyword. The structure is built by defining sections (which act as groupings) and mapping events (or dates) to those sections.
Mermaid
Edit Mermaid in VPasCode
timeline
    title System Development History
    section 2025
        Q1 : Alpha Launch
    section 2026
        Q2 : Beta Release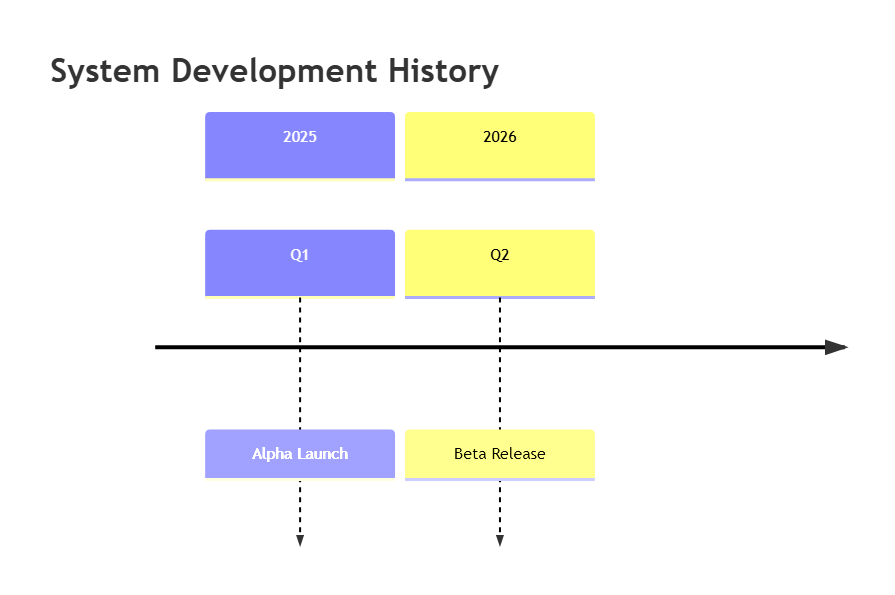
2. Adding Details to Events
You can add multiple details to a single time marker by using a colon-separated list. This is useful for summarizing key outcomes or version numbers associated with a specific date or period.
Mermaid
Edit Mermaid in VPasCode
timeline
    section Q3 2026
        Release : v1.0.0
                : Performance Improvements
                : Security Patches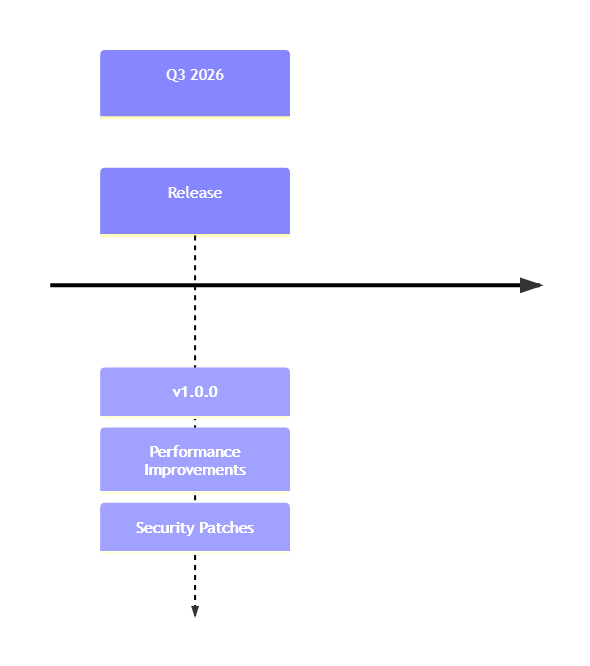
Real-World Mermaid.js Timing Diagram Example: Product Release Roadmap
This blueprint models a multi-year product roadmap, grouping releases by fiscal year and highlighting key deliverables for each cycle.
Mermaid
Edit Mermaid in VPasCode
timeline
    title Product Roadmap 2026-2027
    section 2026
        Q1 : Discovery Phase
           : Stakeholder Interviews
        Q2 : MVP Development
           : Core API Design
        Q3 : Beta Release
           : User Feedback Loops
    section 2027
        Q1 : Full Launch
           : Global Scaling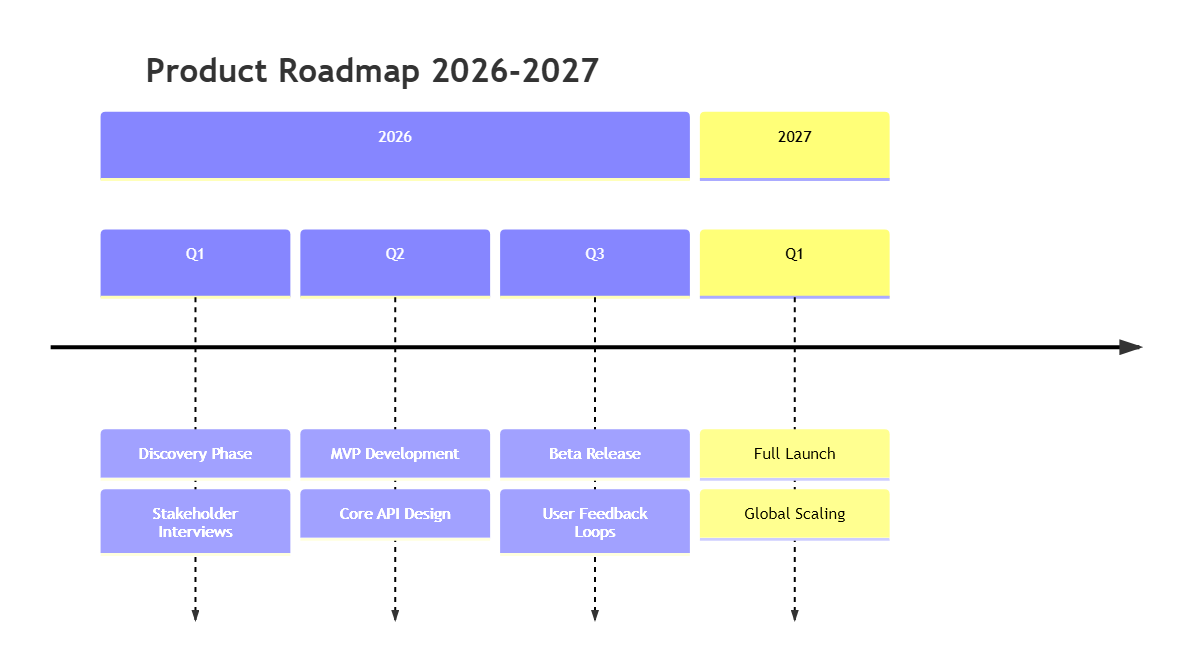
Best Practices for Timelines
- Keep Categories Concise: Use
sectionto denote high-level groupings (like years or major phases), keeping the actual events underneath specific and actionable. - Consistent Date Formatting: Ensure your timeline events are in chronological order in the code, as the Mermaid engine follows your script’s sequence to determine layout placement.
- Use Details for Context: Don’t crowd the central axis with too much text. Use the multi-line event format to break down “what happened” rather than making the date label itself too long.