


The Mechanics of Funnel Charts
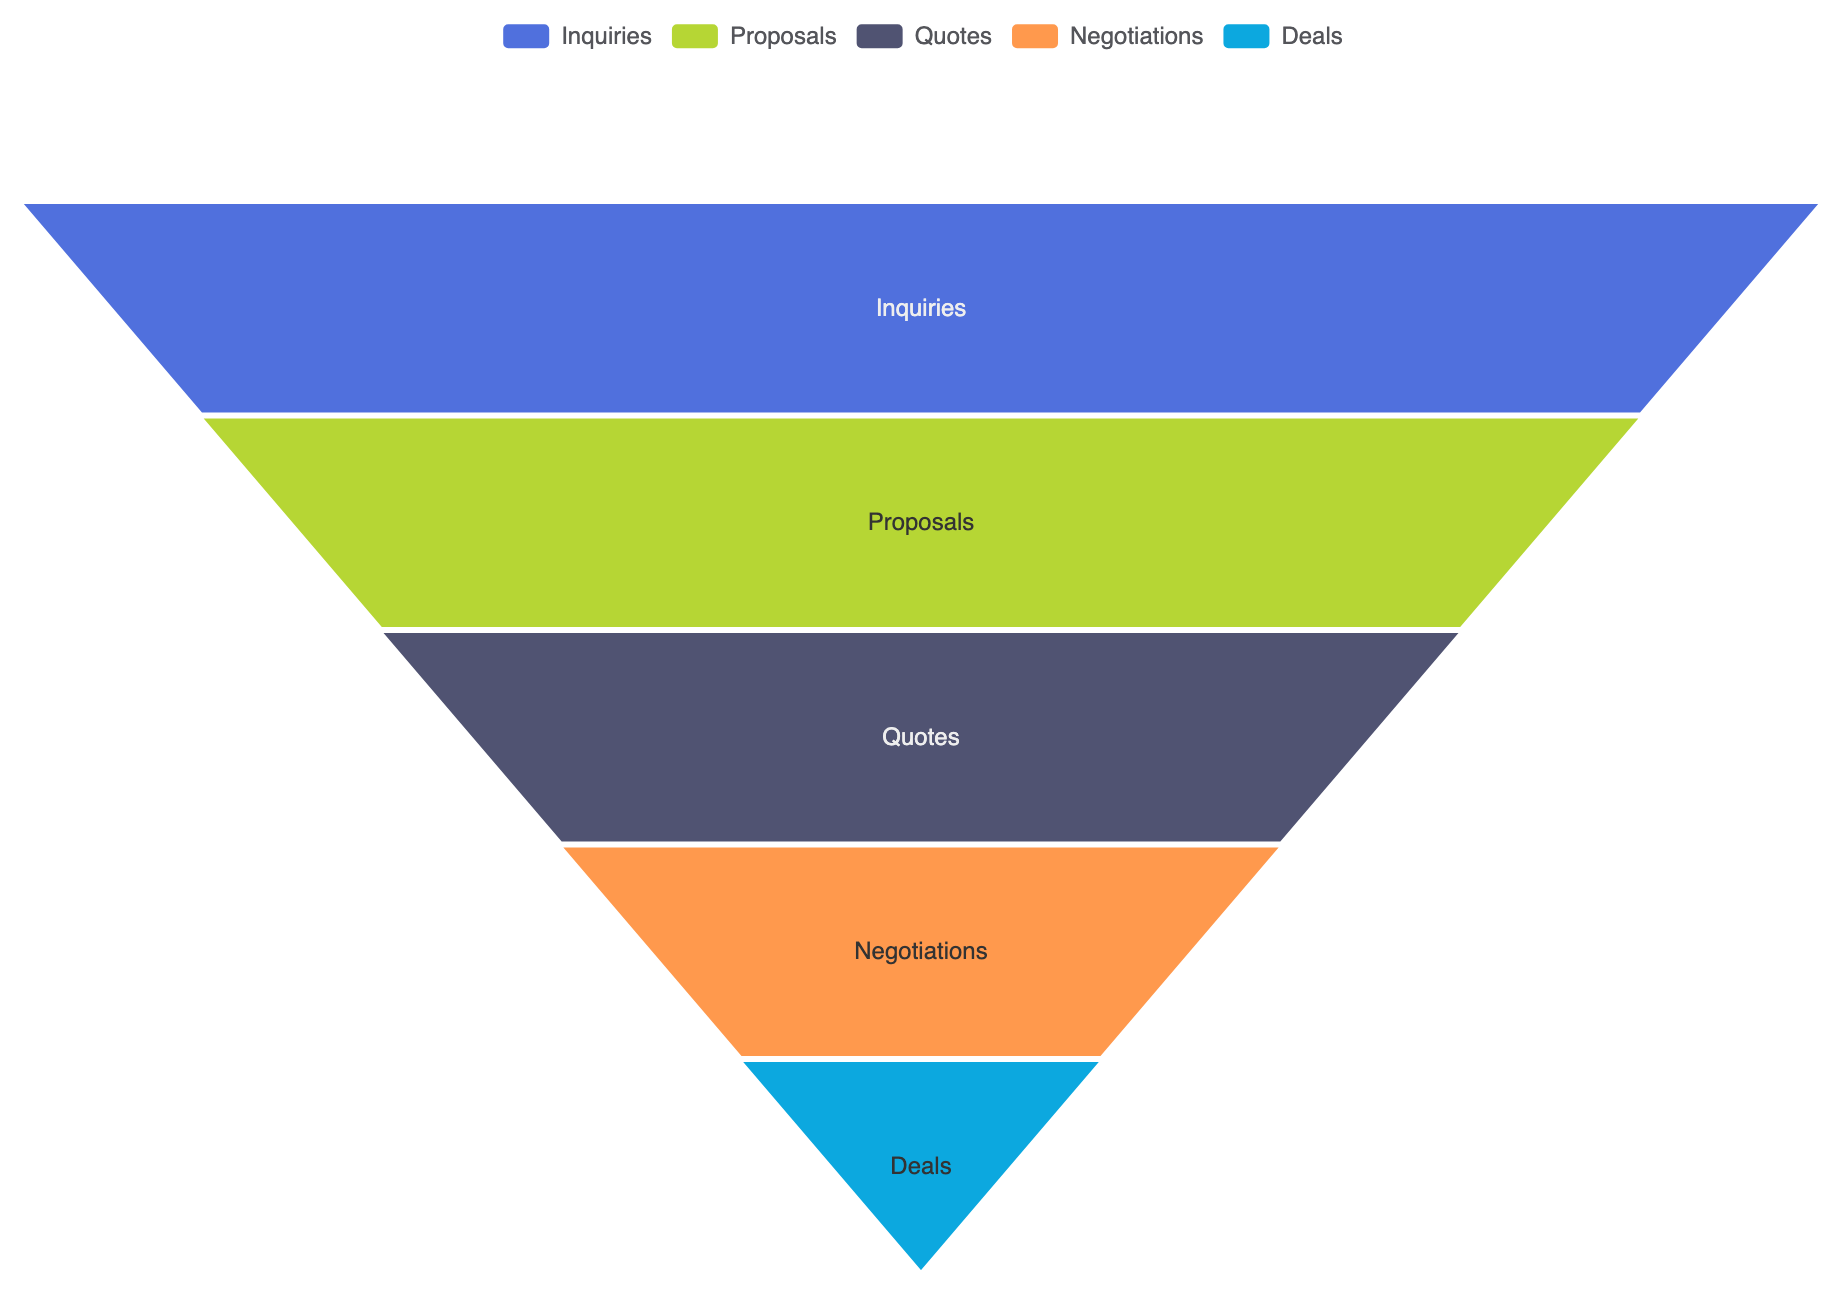
In Apache ECharts, funnel charts are rendered usingtype: 'funnel'. Each data object contains a name and a numeric value. The engine automatically sorts data from largest to smallest (or vice versa) and scales the width of each trapezoid relative to the maximum value in the series.
1. Essential Setup
To construct a basic funnel chart, supply category stages inside your series data array and settype: 'funnel':
ECharts
Edit ECharts in VPasCode
option = {
    tooltip: {
        trigger: 'item',
        formatter: '{a}
{b}: {c} ({d}%)'
    },
    legend: {
        top: '5%',
        left: 'center',
        data: ['Inquiries', 'Proposals', 'Quotes', 'Negotiations', 'Deals']
    },
    series: [
        {
            name: 'Sales Funnel',
            type: 'funnel',
            left: '10%',
            top: '18%',
            bottom: '10%',
            width: '80%',
            min: 0,
            max: 100,
            minSize: '0%',
            maxSize: '100%',
            sort: 'descending',
            gap: 2,
            label: {
                show: true,
                position: 'inside'
            },
            data: [
                { value: 100, name: 'Inquiries' },
                { value: 80, name: 'Proposals' },
                { value: 60, name: 'Quotes' },
                { value: 40, name: 'Negotiations' },
                { value: 20, name: 'Deals' }
            ]
        }
    ]
};
Advanced Structural Techniques
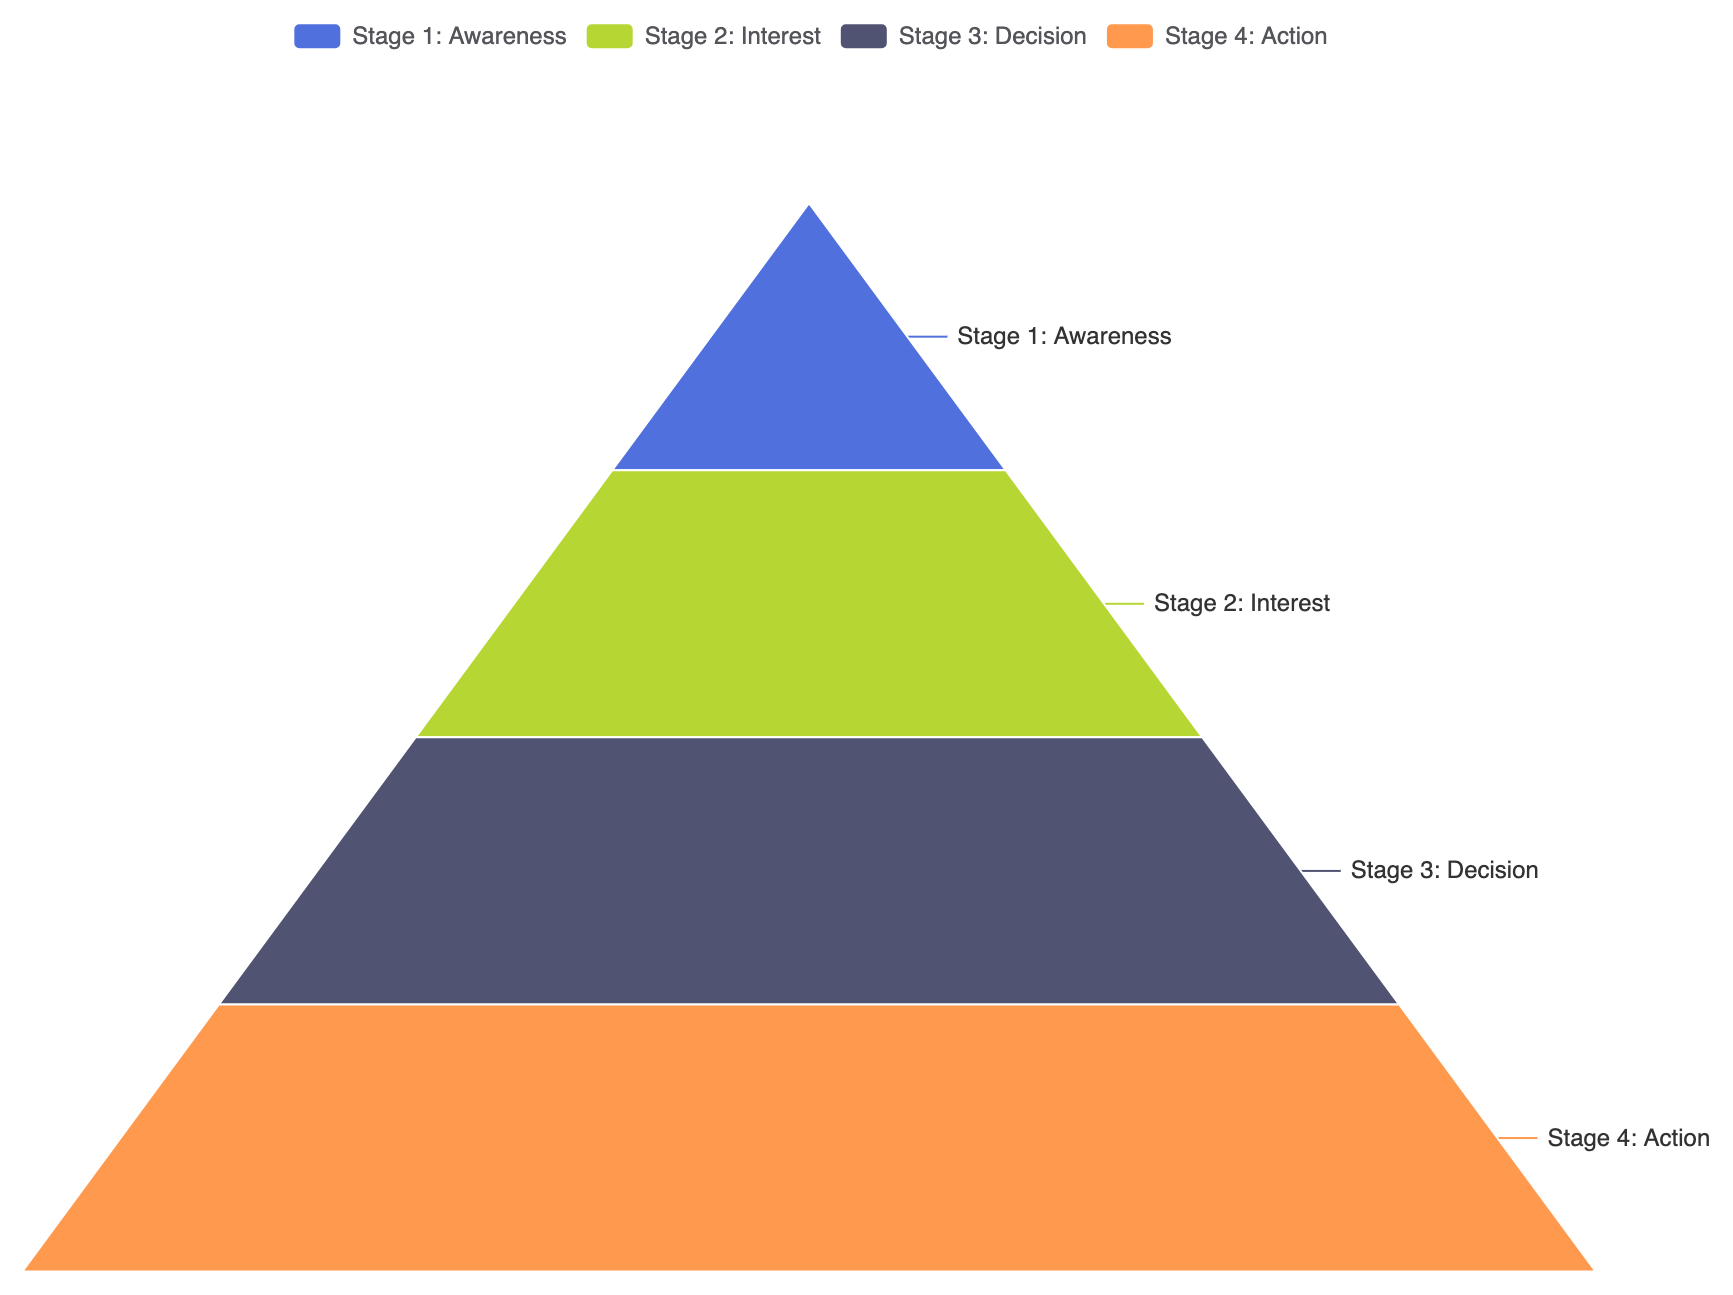
Funnel charts can be customized with pyramid layouts, custom stage alignments, or dual funnel overlays to compare different conversion channels.1. Inverted Pyramid Layout and Custom Alignments
Changesort: 'ascending' to create an inverted pyramid, or adjust funnelAlign to align stages along the left or right edge:
ECharts
Edit ECharts in VPasCode
option = {
    tooltip: {
        trigger: 'item',
        formatter: '{b}: {c}%'
    },
    legend: {
        top: '5%',
        left: 'center'
    },
    series: [
        {
            name: 'Conversion Pyramid',
            type: 'funnel',
            left: '15%',
            top: '18%',
            bottom: '10%',
            width: '70%',
            sort: 'ascending', // Renders smallest stage at top, largest at bottom
            funnelAlign: 'center',
            label: {
                show: true,
                position: 'right'
            },
            data: [
                { value: 20, name: 'Stage 1: Awareness' },
                { value: 40, name: 'Stage 2: Interest' },
                { value: 60, name: 'Stage 3: Decision' },
                { value: 80, name: 'Stage 4: Action' }
            ]
        }
    ]
};
Fine-Tuning Layout and Stage Styling
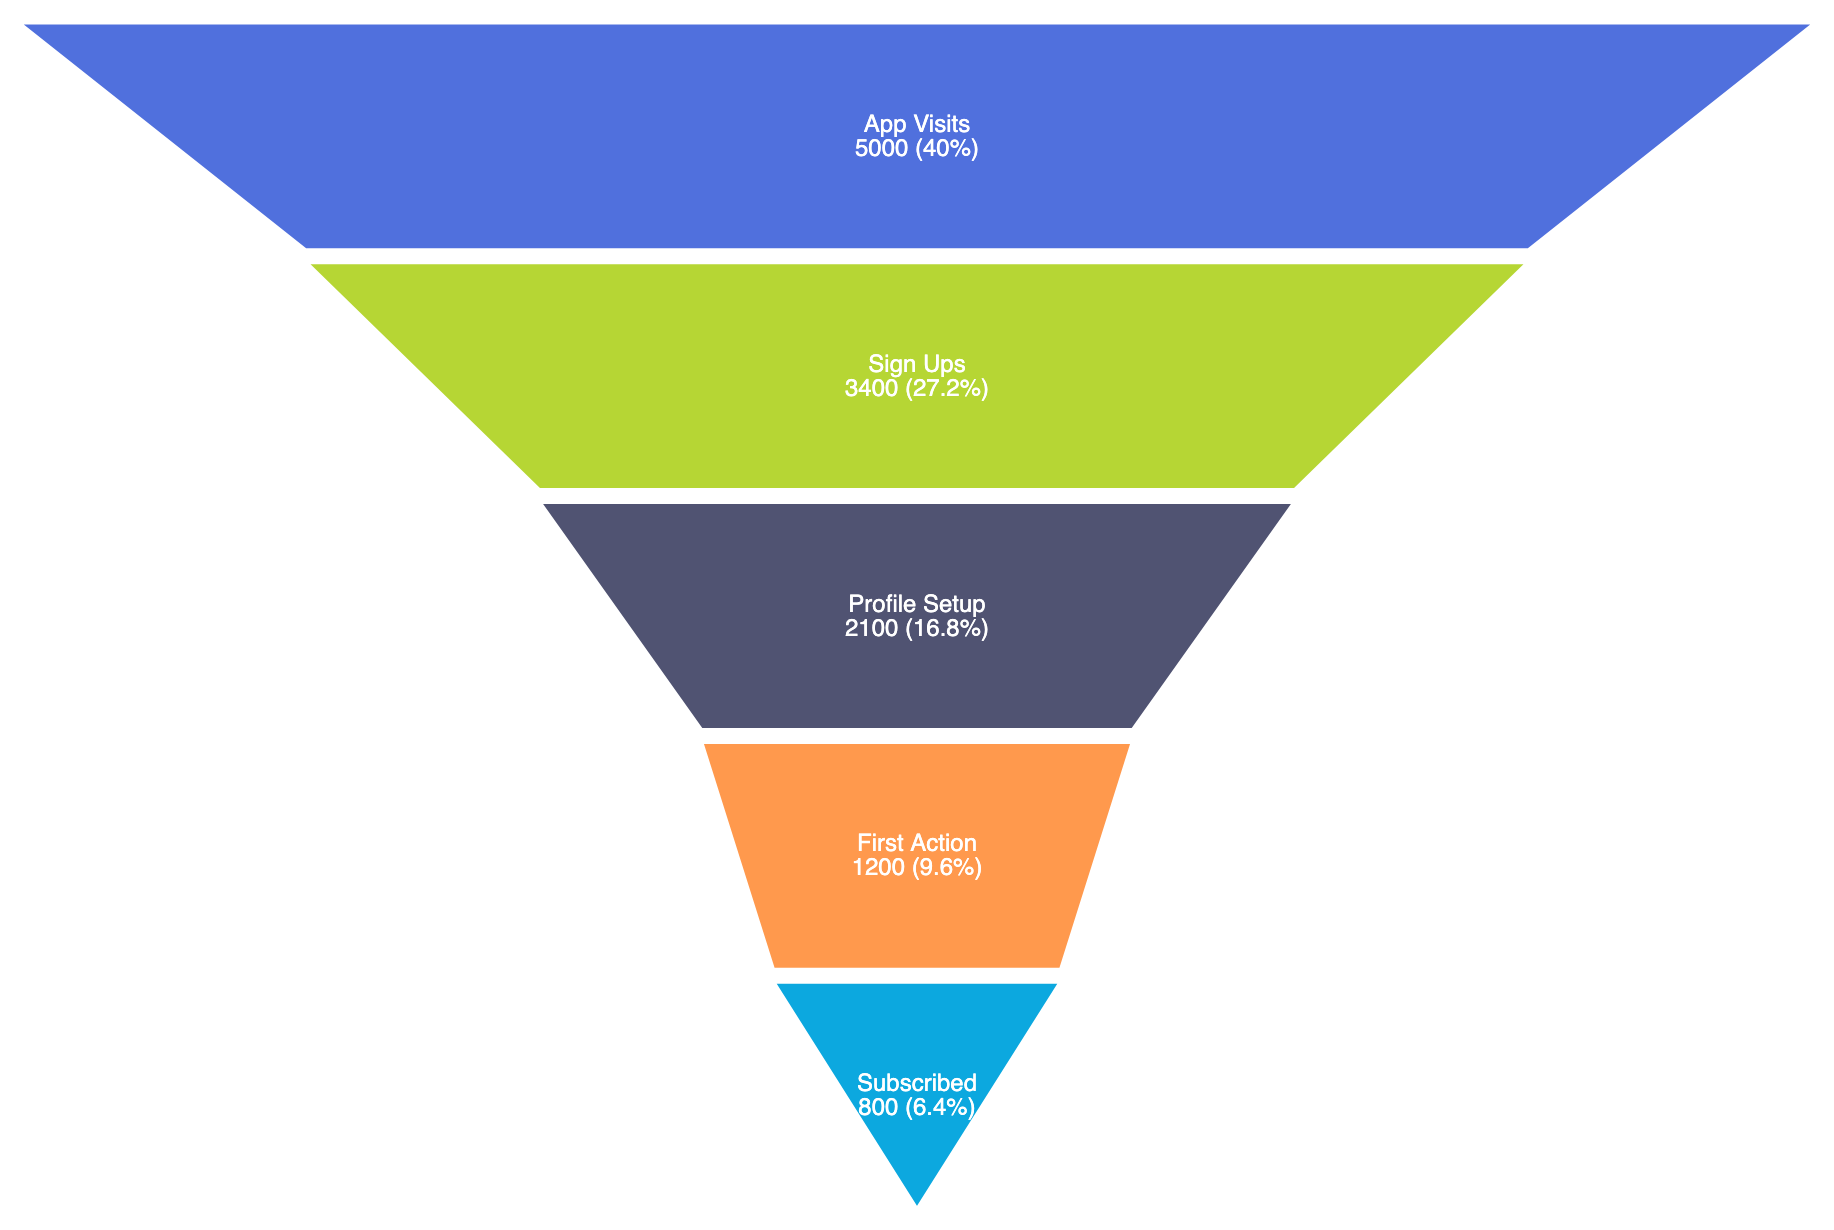
Adding gaps, rounded borders, and custom label formatters creates clean spacing between conversion stages.1. Custom Stage Spacing and Percentage Labels
Controlgap spacing between trapezoids and use custom label formatters to highlight percentage retention across stages:
ECharts
Edit ECharts in VPasCode
option = {
    tooltip: {
        trigger: 'item',
        formatter: '{b}: {c} Users'
    },
    series: [
        {
            name: 'User Onboarding',
            type: 'funnel',
            left: '10%',
            top: '10%',
            bottom: '10%',
            width: '80%',
            gap: 6, // Adds clear separation between stages
            itemStyle: {
                borderColor: '#ffffff',
                borderWidth: 2,
                borderRadius: 4
            },
            label: {
                show: true,
                position: 'inside',
                formatter: '{b}\n{c} ({d}%)',
                color: '#fff',
                fontSize: 12
            },
            data: [
                { value: 5000, name: 'App Visits' },
                { value: 3400, name: 'Sign Ups' },
                { value: 2100, name: 'Profile Setup' },
                { value: 1200, name: 'First Action' },
                { value: 800, name: 'Subscribed' }
            ]
        }
    ]
};
Strategic Best Practices
- Keep Stages Sequential: Funnel charts rely on sequential flow logic. Ensure data items represent actual step-by-step processes rather than unrelated categories.
- Use
gapfor Clear Visual Stage Bounds: Setting a smallgap(e.g., 4px to 6px) between trapezoids prevents adjacent colors from bleeding together into a single block. - Display Stage Percentages: Combine raw numbers with step percentages (e.g., using
{d}%in label formatters) so users can instantly evaluate drop-off ratios at each milestone.